Analysis Of Regulatory Effects
The moderation effect refers to the fact that if the relationship between variable Y and variable X is a function of variable M, the relationship between Y and X is influenced by the third variable M. If the relationship between the dependent variable and the independent variable (the magnitude and direction of the regression slope) changes with the change of the third variable, it is said to have a moderating effect between and, and at this point it is called the moderating variable.
Data description:
Regulatory analysis is a statistical method used to study whether there is a difference in the influence of another independent variable on the dependent variable under specific conditions of one independent variable. Here, regulatory analysis explores the regulatory effect of A2 on the relationship between A3 and A1 by introducing the interaction terms between A2 and A3. By comparing the coefficients of A2 in Model 2 and Model 3, it can be understood whether A2 plays a regulatory role in the relationship between A3 and A1.
In this regulation effect model, the coefficient table of regulation effect model shows the coefficients, standard errors, t values and p values of three regulation models (model 1, model 2 and model 3). Researchers want to explore the influencing factors and interaction effects of the dependent variable A1. For Model 1 and Model 2, only the impact of A3 is included; Model 3 additionally considers the interaction between A2 and A3 with A2. By analyzing the coefficients of different models, we can evaluate the contribution and statistical significance of different influencing factors to the dependent variable A1.
The analysis results are as follows:
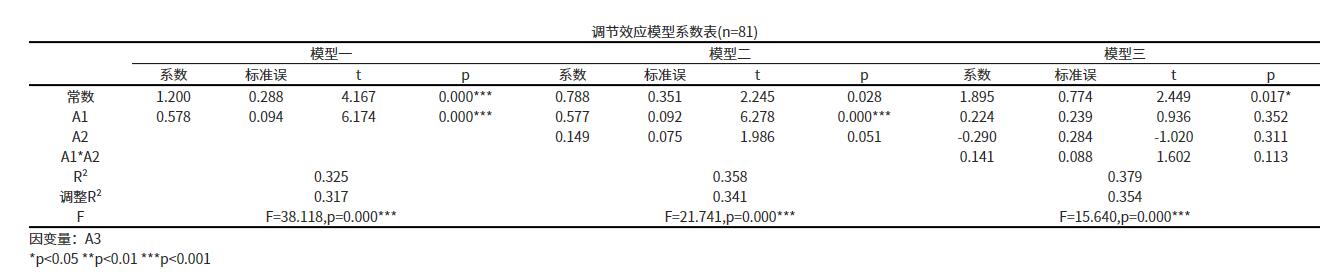
In Model 1, the independent variable A1 was regressed on the dependent variable A3, and the results showed that there was a significant positive effect of A1 on A3 with a beta value of 0.5783 and a p-value of 0.0 (p<0.05). Regression equation for model 1:A3 = 1.2002 + 0.5783*A1.
In model 2, the independent variable A1, moderator variable A2 and dependent variable A3 were regressed and analyzed, and the results showed that there was a significant positive effect of A1 on A3 with a beta value of 0.5774 and a p-value of 0.0 (p<0.05). The regression equation for model 2:A3 = 0.7878 + 0.5774*A1 + 0.1494*A2.
In Model 3, the independent variable A1, the moderator variable A2, and the interaction term between the independent variable A1 and the moderator variable A2 were regressed on the dependent variable A3, and none of the independent variables played a significant role in influencing the dependent variable A3 (p>0.05). Regression equation for model 3:A3 = 1.8949 + 0.2236*A1 - 0.2899*A2 + 0.1411*A1*A2.
The results show that the significance of the interaction term in Model 3 is greater than 0.05, indicating that the moderating effect under this path is not significant.
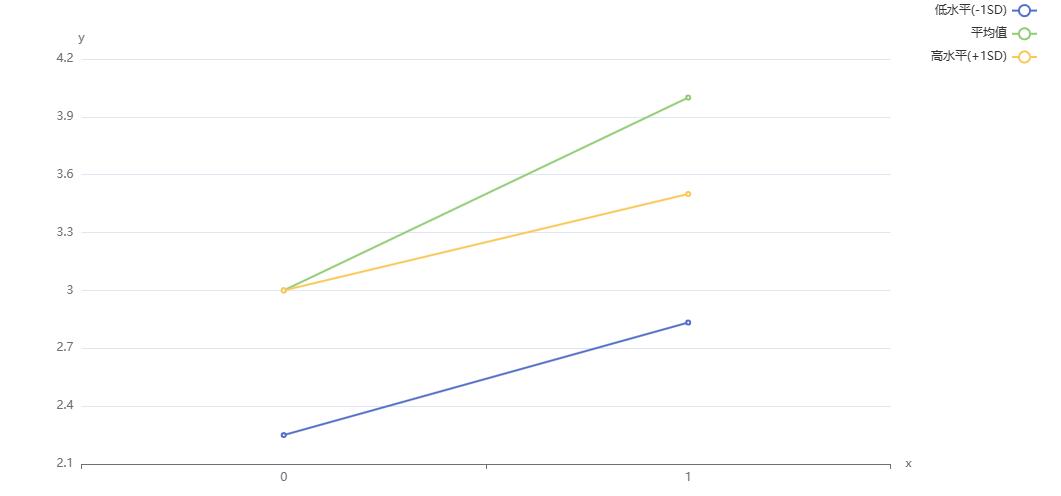
SPSSMAX also outputs a regulatory effect map:
Reference:
[1]耿新,张体勤.企业家社会资本对组织动态能力的影响——以组织宽裕为调节变量.《 CNKI;WanFang 》,2010
[2]张莉,林与川. 实验研究中的调节变量和中介变量.《 CNKI;WanFang 》,2011
[3]辛自强,郭素然,池丽萍.青少年自尊与攻击的关系:中介变量和调节变量的作用.《 CNKI;WanFang 》,2007
[4]卢谢峰,韩立敏.中介变量、调节变量与协变量——概念、统计检验及其比较.《 CNKI;WanFang 》,2007
[5]廖飞,施丽芳,茅宁,丁德明.竞争优势感知,个人声誉激励与知识工作者的内生动机:以知识的隐性程度为调节变量.《 CNKI;WanFang 》,2010
关注微信公众号发送【示例数据】获取SPSSMAX练习示例数据。
