Analysis Of Variance
Analysis of Variance (ANOVA), also known as "analysis of variance" or "F-test", is used to test the significance of differences in mean between two or more samples. Due to various factors, the data obtained from the study shows a fluctuating pattern. The reasons for fluctuations can be divided into two categories, one is uncontrollable random factors, and the other is controllable factors applied in the study that affect the results, used for significance testing of differences in mean values between two or more samples.
Data description:
Background description:
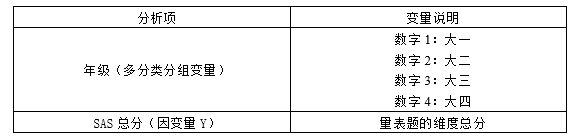
Analysis of variance is a statistical method used to compare the differences in the mean values of two or more samples. In this example, we studied the performance of students in different grades (1, 2, 3, and 4) on the total SAS score. Analysis of variance can help us understand whether there are significant differences between different grades and which items have significant differences between different grades. These results are of great significance for understanding students' academic development and curriculum arrangements.
The analysis results are as follows:

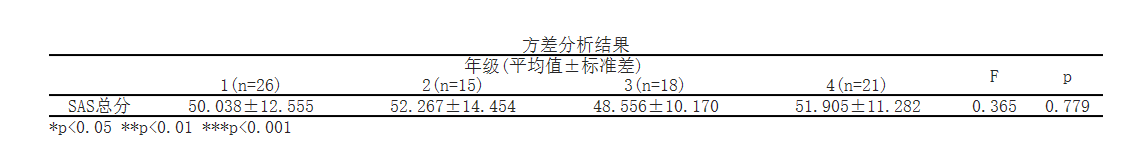
From the above table, it can be seen that conducting one-way analysis of variance (also known as one-way analysis of variance) on the total SAS scores showed an F-value of 0.365 and a p-value of 0.779, indicating that there was no significant difference in the total SAS scores among different groups (p>0.05).
Detailed explanation of each indicator:
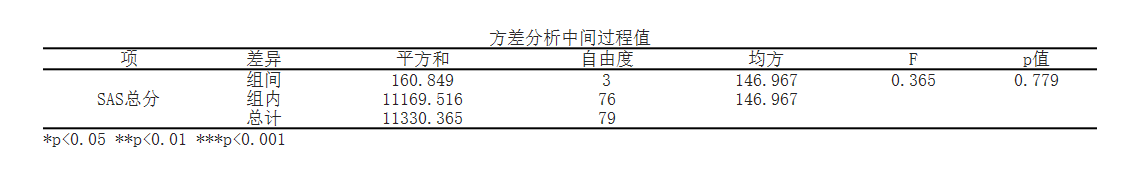
1. Differences: Intragroup differences between groups.
2. Sum of squares: The sum of squares represents the sum of squares between data from different groups (grades). This value is used to calculate variance and subsequent F-values.
3. Degrees of Freedom: Degrees of freedom represent the number of data that can freely change in variance analysis. For inter group differences, the degree of freedom is the number of groups minus 1; For intra group differences, the degree of freedom is the total number of individuals minus the number of groups.
4. Mean square: Mean square is the ratio of the sum of squares to degrees of freedom, used to evaluate the degree of difference. In the analysis of variance, we calculated the inter group mean square and intra group mean square.
5. F-value: F-value is used to determine the significance level of differences between groups. It is the ratio of inter group mean square to intra group mean square. In this example, we calculated the F value for each item.
6. P-value: p-value represents the significance level of F-value. It reflects the statistical significance of the differences. In this example, we provide the p-value for each item.
Reference:
[1] 中国科学院数学研究所统计组 .方差分析 :科学出版社 ,1977
[2] 刘仁权.spss统计软件.北京:中国中医药出版社,2007:50
[3] 贾俊平,何晓群,金勇进 著 .统计学:中国人民大学出版社 ,2015
关注微信公众号发送【示例数据】获取SPSSMAX练习示例数据。
