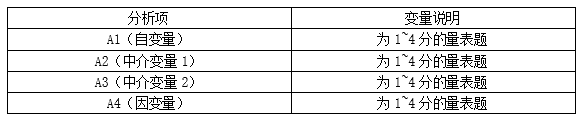
Chain Intermediary
A statistical analysis method used to explore whether the relationship between independent and dependent variables is explained by one or more mediating variables. It is mainly used to study the influence mechanism of one variable on another variable, revealing the role of intermediary variables in the effect of independent variables on dependent variables. In practical applications, chain mediated analysis is a method used to explore the mechanism of the influence of independent variables on dependent variables, explaining the relationship between independent variables and dependent variables through the testing of intermediate variables. It is very useful for revealing the mediating effects between variables and deepening the understanding of causal mechanisms.
Data description:
Background note: It can be said that indicator A2 has a chain mediating effect, which affects indicator B through the mediating variable A4. However, the impact effect of indicator A3 is not through the mediating variable A4, but through the mediating variables A2 and A4 on indicator B. It should be noted that the explanatory power of the model is determined by R ² And adjusted R ² To measure. In this model, R ² Values between 0 and 1, higher R ² The value representation model can explain significant variability. The F-value and p-value are used to test the significance of the entire model.
The analysis results are as follows:
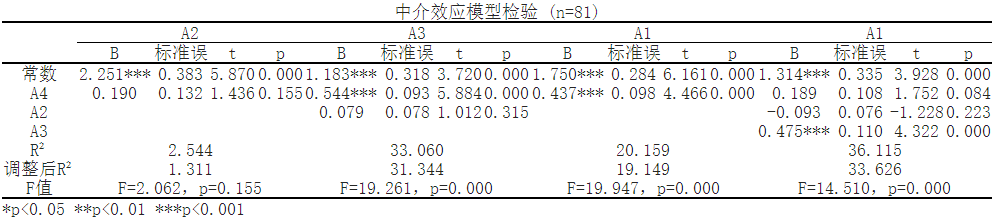
In Model One, the results showed that none of the independent variables had a significant impact on the dependent variable A2 (p>0.05). The model formula is: A2=2.251+0.1897 * A4
In Model 2, A4 has a significant positive effect on A3, with a beta value of 0.5445 and a p-value of 0.0 (p<0.05). The model formula is: A3=1.1825+0.5445 * A4+0.0787 * A2
In Model 3, A4 has a significant positive effect on A1, with a beta value of 0.4368 and a p-value of 0.0 (p<0.05). The model formula is: A1=1.7497+0.4368 * A4
In Model 4, A3 has a significant positive effect on A1, with a beta value of 0.4747 and a p-value of 0.0 (p<0.05). The model formula is: A1=1.3142+0.1889 * A4-0.0933 * A2+0.4747 * A3
Indicator Explanation:
1.Standard error: Refers to the uncertainty of the estimated value. A smaller standard error indicates a higher reliability of the estimated value.
2.T-value: a statistic used to test whether the estimated value is significantly not equal to zero. P-value: represents the probability that the observed statistic is completely consistent with the null hypothesis. A smaller p-value indicates weak support for the null hypothesis in the observed data.
3.Constant: The intercept term in the model, which represents the predicted value of the dependent variable when all independent variables are zero.
4.B: Regression coefficient, the larger the coefficient, the greater the impact.
关注微信公众号发送【示例数据】获取SPSSMAX练习示例数据。
