Chi-Square Test
The chi square test is used in statistical inference of categorical data, which involves comparing two rates or two constituent ratios; Chi-square test for comparing multiple rates or components, as well as correlation analysis of categorical data.
The chi square value in the calculation result is the degree of deviation between the actual observation value and the theoretical inference value of the statistical sample. The degree of deviation between the actual observation value and the theoretical inference value determines the size of the chi square value. If the chi square value is larger, the degree of deviation between the two is greater; On the contrary, the smaller the deviation between the two; If two values are completely equal, the chi square value is 0, indicating that the theoretical value is completely consistent.
The chi square test can help us determine whether there is a statistically significant correlation between two or more categorical variables. It is often used to analyze the relationship between two categorical variables, such as gender and grade, whether it is an only child and gender, and the number of brothers and sisters and gender. Through the chi square test, we can understand the differences between different groups and further investigate and explain potential correlations.
Data description:
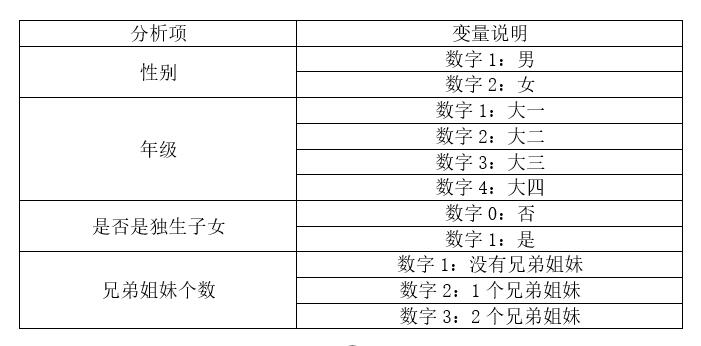
Data description:
These data provide chi square values and p-values between different variables. It may be based on the survey of a citizen to investigate the relationship between grade, whether he is an only child, the number of brothers and sisters and gender. According to the given chi square value and p value, we can infer that there is no significant statistical relationship between grade and gender, and between the number of brothers and sisters and gender, that is, there is no significant statistical relationship between the two variables. The relationship between being an only child and gender is statistically independent, meaning there is no correlation between the two variables. These results can provide a basis for further research and analysis.
The results show:
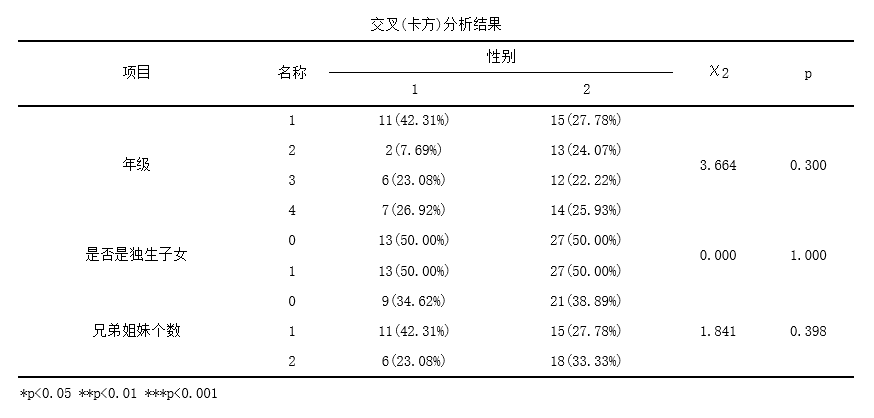
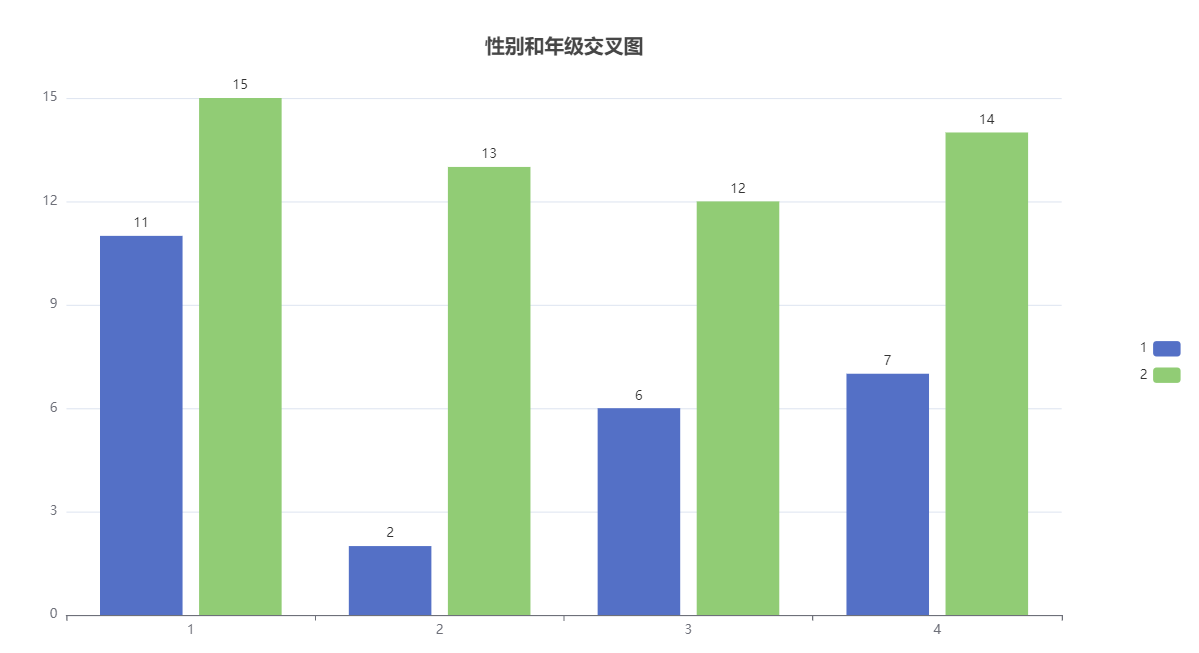
The chi square test results show that using chi square test (cross analysis) to study the relationship between gender and grade differences, it can be seen from the above table that the p-value is 0.3>0.05, and the chi square value is 3.664, indicating that there is no significant difference between the data, and the data distribution is relatively uniform.
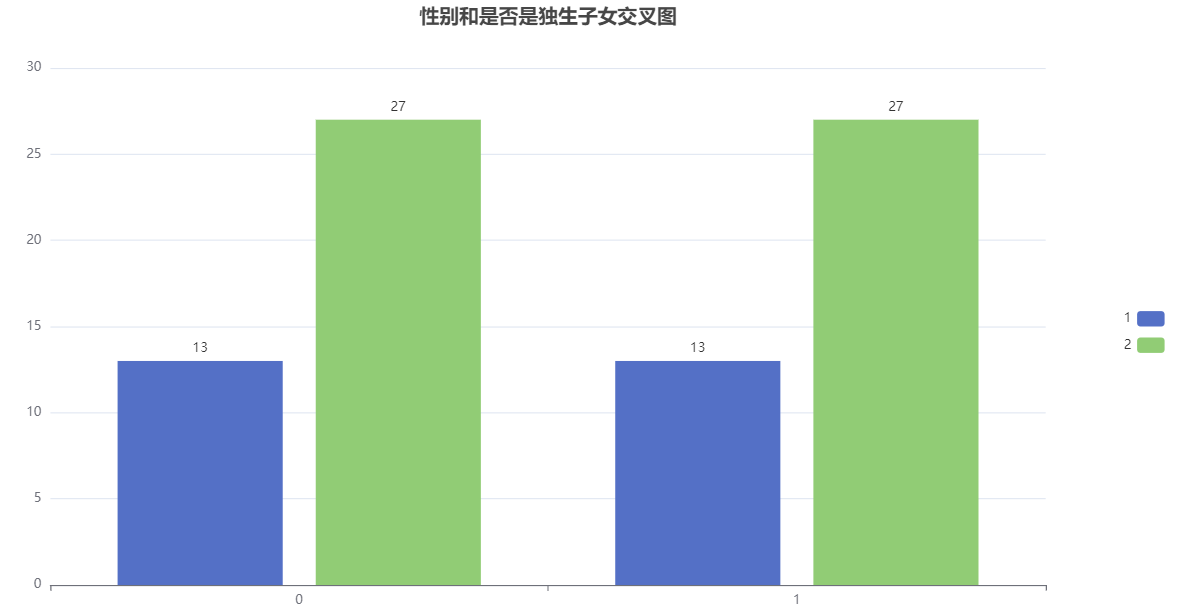
The chi square test results show that using chi square test (cross analysis) to study the difference relationship between gender and whether one is an only child, it can be seen from the above table that the p-value is 1.0>0.05, and the chi square value is 0.0, indicating that there is no significant difference between the data, and the data distribution is relatively uniform.
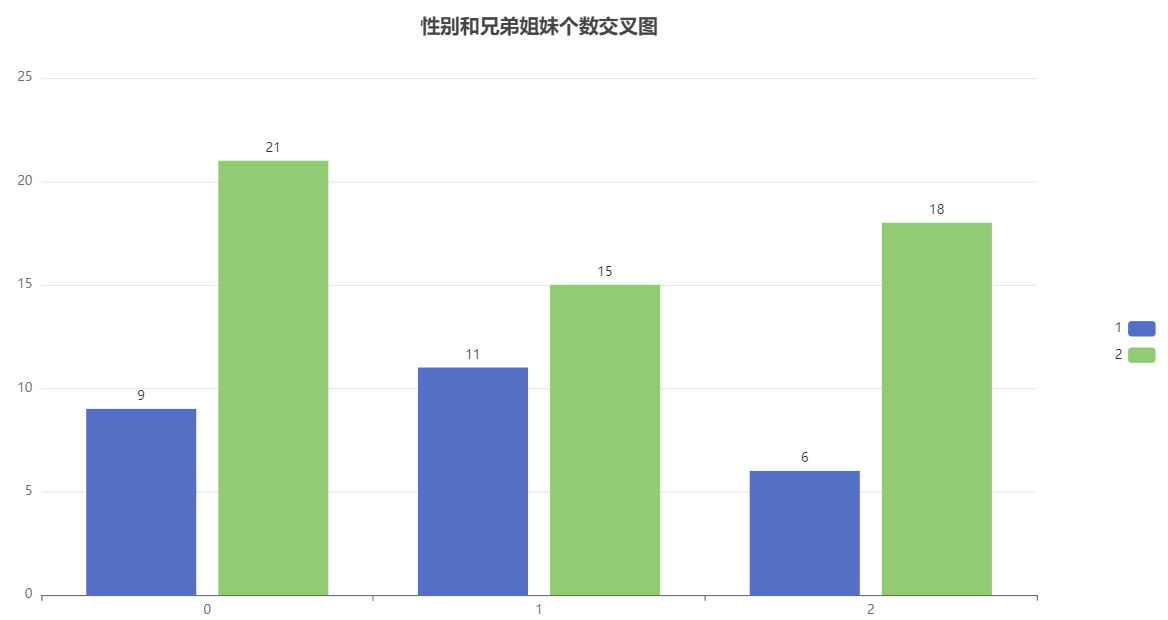
The chi square test results show that the chi square test (cross analysis) is used to study the difference relationship between gender and the number of brothers and sisters. From the table above, we can see that the p value is 0.398>0.05, and the chi square value is 1.841, indicating that there is no significant difference between the data, and the data distribution is relatively uniform.
Result interpretation:
Chi square analysis is a statistical method used to compare the correlation between two or more categorical variables. It determines whether two variables are independent based on the difference between the observed value and the expected value. Chi square value( χ 2) The p-value is the result indicator of chi square analysis.
Chi square value( χ 2) The chi square value is used to measure the degree of deviation between observed data and expected data. The larger the chi square value, the greater the difference between the observed data and the expected data.
P-value: p-value is a probability value calculated based on the chi square distribution, representing the probability of the difference between the observed data and the expected data under the null hypothesis. If the p-value is less than the set significance level (usually 0.05), the null hypothesis can be rejected as there is a significant correlation between the two variables.
The analysis graph is as follows:
Reference:
[1] 王金桃, 周利锋, 高尔生. 第六讲 卡方检验[J]. 实验动物与比较医学, 2000(4):251-254.
[2]鲁庆云, 刘红霞. 关于列联表卡方检验在数学教育研究中的使用方法分析[J]. 统计与决策, 2008(2):156-158.
关注微信公众号发送【示例数据】获取SPSSMAX练习示例数据。
