Descriptive Statistics
Descriptive statistics is a method of organizing and analyzing data through charts or mathematical methods, and estimating and describing the distribution status, numerical characteristics, and relationships between random variables of data.
Descriptive statistics are divided into centralized trend analysis and off center trend analysis.
Centralized trend analysis mainly relies on statistical indicators such as mean, median, and mode to represent the concentrated trend of data.
Deviation trend analysis mainly relies on statistical indicators such as full range, quartile difference, mean deviation, variance, and standard deviation to study the deviation trend of data.
Data description:
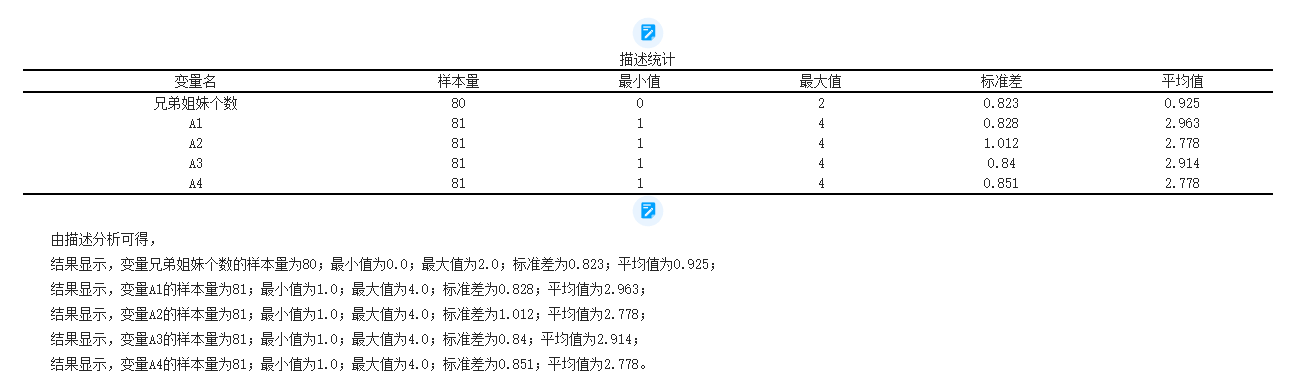
The analysis table is as follows:
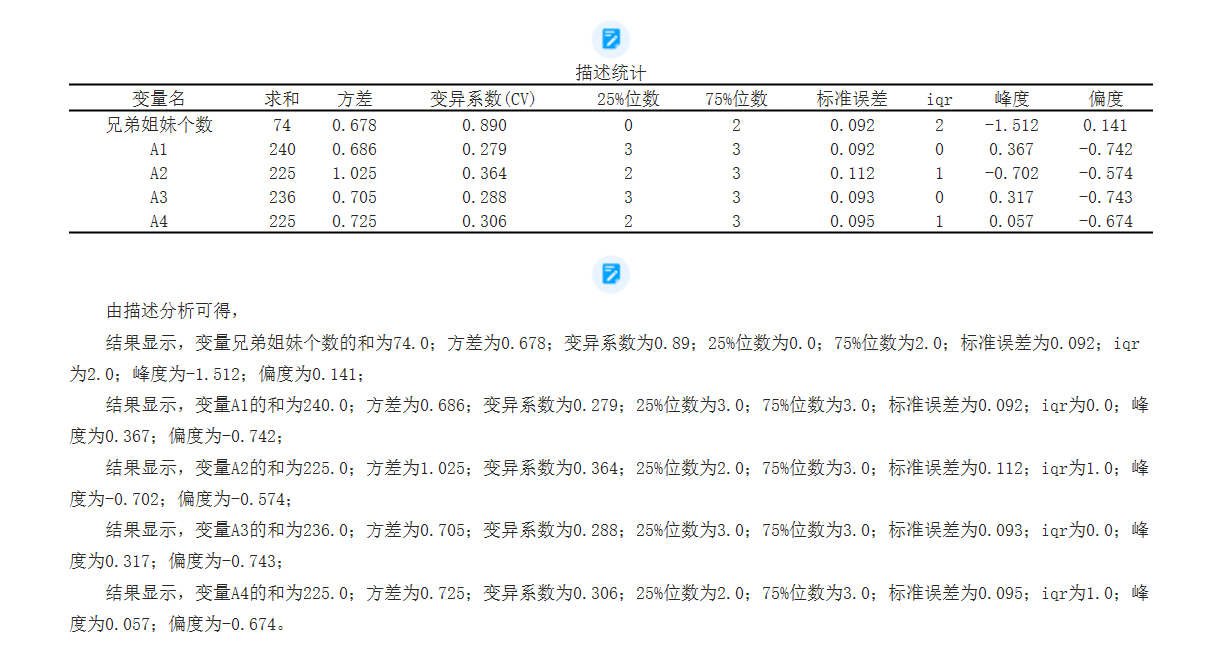
The following is a detailed explanation of each indicator:
1. Sum: The sum indicator represents the result of adding all values in a set of data. It is a simple statistic used to represent the total amount of a population or sample.
2. Variance: Variance is an indicator that measures the degree of data dispersion. It represents the degree of difference between the observed values of the data and their average values. The larger the variance, the greater the degree of dispersion of the data.
3. Coefficient of Variation (CV): The coefficient of variation is also an indicator of the degree of dispersion of data, which is the ratio of variance to mean. The coefficient of variation can compare the degree of dispersion between different samples or populations. A smaller coefficient of variation indicates that the data is relatively stable, while a larger coefficient of variation indicates that the data is relatively unstable./5)。
4.25% and 75%: These two indicators are also known as quartiles. The 25% digit, also known as the first quartile, indicates that 25% of the observed values in the dataset are below this value; The 75% digit, also known as the third quartile, indicates that 75% of the observed values in the dataset are below this value. The quartile can be used to describe the distribution of data and detect outliers.
5. Standard error: Standard error refers to the difference between the sample mean and the population mean. It is an indicator of the accuracy of sample mean estimation. The smaller the standard error, the more accurate the sample mean estimation.
6. IQR: IQR is the interquartile distance, which refers to the difference between 75% and 25% of the digits. It can be used to measure the degree of dispersion of data. A larger IQR indicates a wider distribution of data, while a smaller IQR indicates a more concentrated distribution of data.
7. Kurtosis: Kurtosis is an indicator of the steepness or flatness of the distribution pattern of data. The kurtosis of a normal distribution is 3. If the kurtosis is greater than 3, the data exhibits a sharp distribution; If the kurtosis is less than 3, the data presents a flat distribution.
8. Skewness: Skewness is an indicator that measures the symmetry of data distribution. A skewness of 0 indicates that the data distribution is completely symmetrical, a skewness greater than 0 indicates that the data distribution is biased to the right (positive), and a skewness less than 0 indicates that the data distribution is biased to the left (negative).
The analysis graph is as follows:
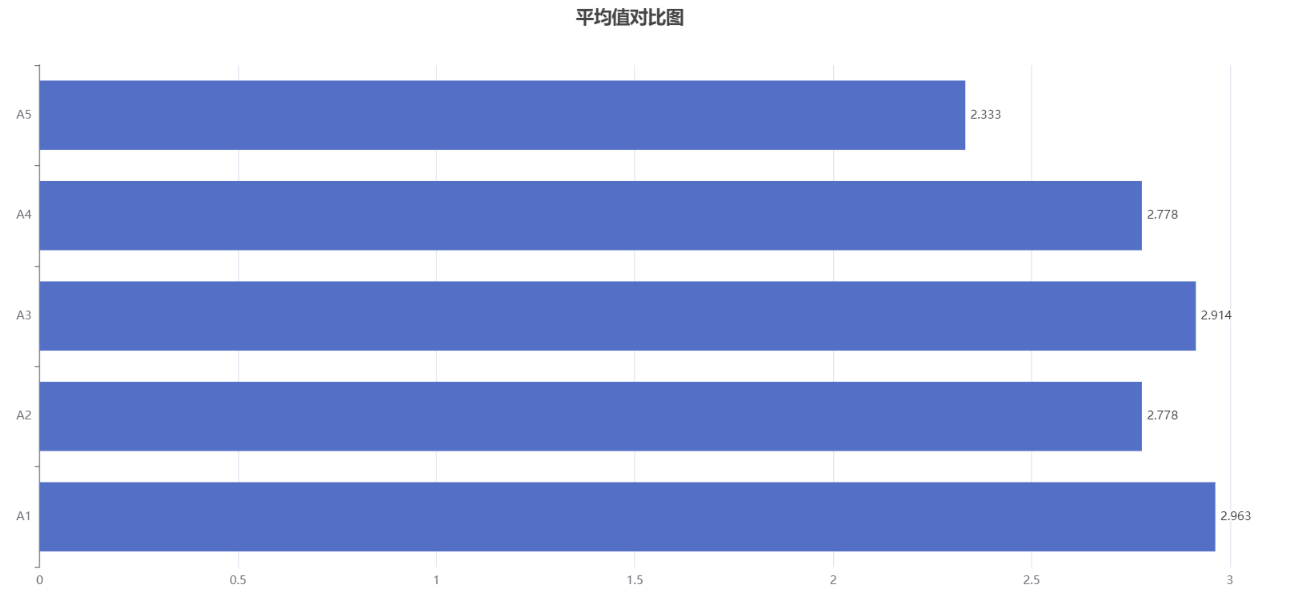
A bar chart is a common data visualization method used to compare data between different categories or groups. It consists of a series of vertical or horizontal rectangular bars, each with a length that represents the size of the data.
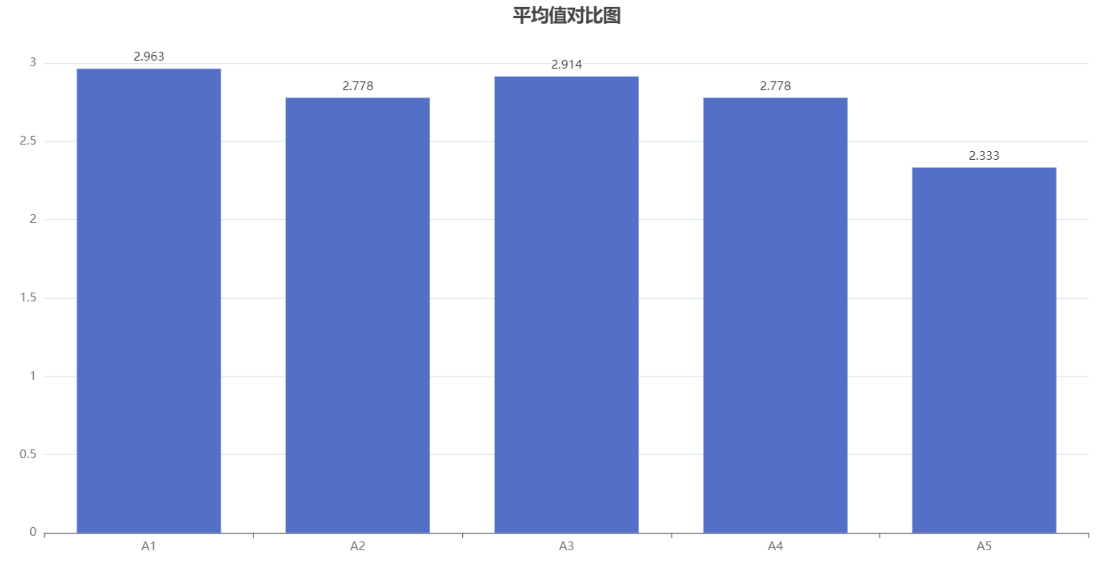
A two-dimensional bar chart is a commonly used data visualization method used to display the quantity or comparison of different categories or groups. It consists of two axes, horizontal and vertical, where the horizontal axis represents different categories or groups, and the vertical axis represents quantity or proportion. Each category or group is represented by a bar, with its height or length associated with the corresponding numerical value.
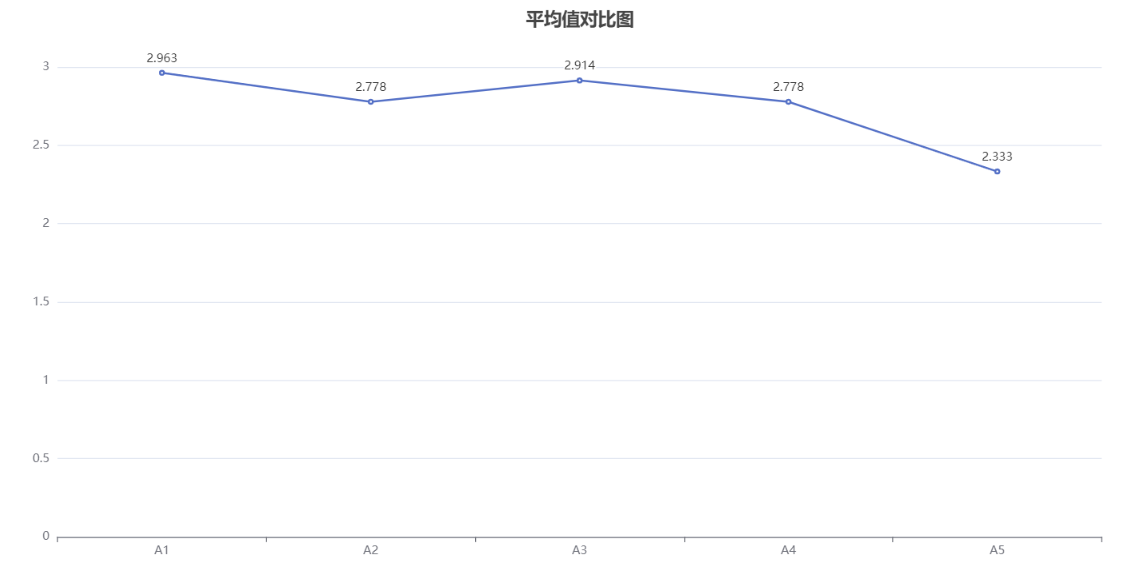
Line chart is a common data visualization method used to display the trend of data over time, sequence, or other continuous variables. It consists of one or more polylines, each representing the trend of different variables changing with the change of independent variables.
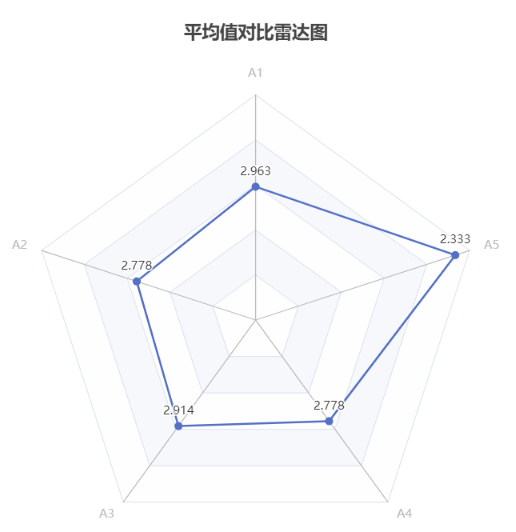
Radar chart is a data visualization method used to compare the relationships between multiple variables or options. It consists of a center point and multiple equidistant axes, each axis representing a variable, and the length extending from the center point to different directions represents the value of the variable.
关注微信公众号发送【示例数据】获取SPSSMAX练习示例数据。
