Differential Analysis
Difference essentially means subtracting the previous value from the next value, mainly to eliminate some fluctuations and make the data tend to be stationary. Non stationary sequences can be transformed into stationary sequences through difference transformation. Differential analysis is a commonly used data analysis method used to study the differences between variables. It can be used to compare variable values across different groups, time points, or processing conditions, and help us understand whether these differences are statistically significant.
The basic idea of differential analysis is to infer the impact of different factors on variables by calculating and comparing the mean differences of variables.
Data description:
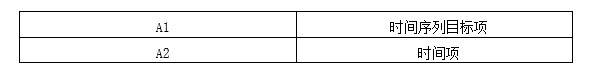
Background description:
Differential analysis test chart is a chart used to visualize the results of differential analysis tests. It is usually a line chart, with the horizontal axis representing the order of the difference and the vertical axis representing the values of the difference analysis statistics. In the chart, we can observe the changes in differential analysis statistics under different differential orders.
The function of differential analysis test chart is to help us judge the stationarity of time series data. By observing the trends of differential analysis statistics at different differential orders, we can determine the optimal differential order to eliminate non-stationary effects. If the differential analysis statistic gradually stabilizes after increasing the order of differences, i.e. shows a horizontal trend, then we can consider the time series data to be stationary.
The difference analysis test chart can also be used to compare the stationarity of different variables. By plotting the difference analysis results of multiple variables on the same graph, we can intuitively compare their stationarity. If the value of the difference analysis statistic for a variable is closer to zero and tends to stabilize after increasing the difference order, then we can consider that the variable has more stationarity.
In summary, the difference analysis test chart is a visual tool that helps to determine the stationarity of time series data, helping us choose the appropriate difference order and compare the stationarity of different variables.
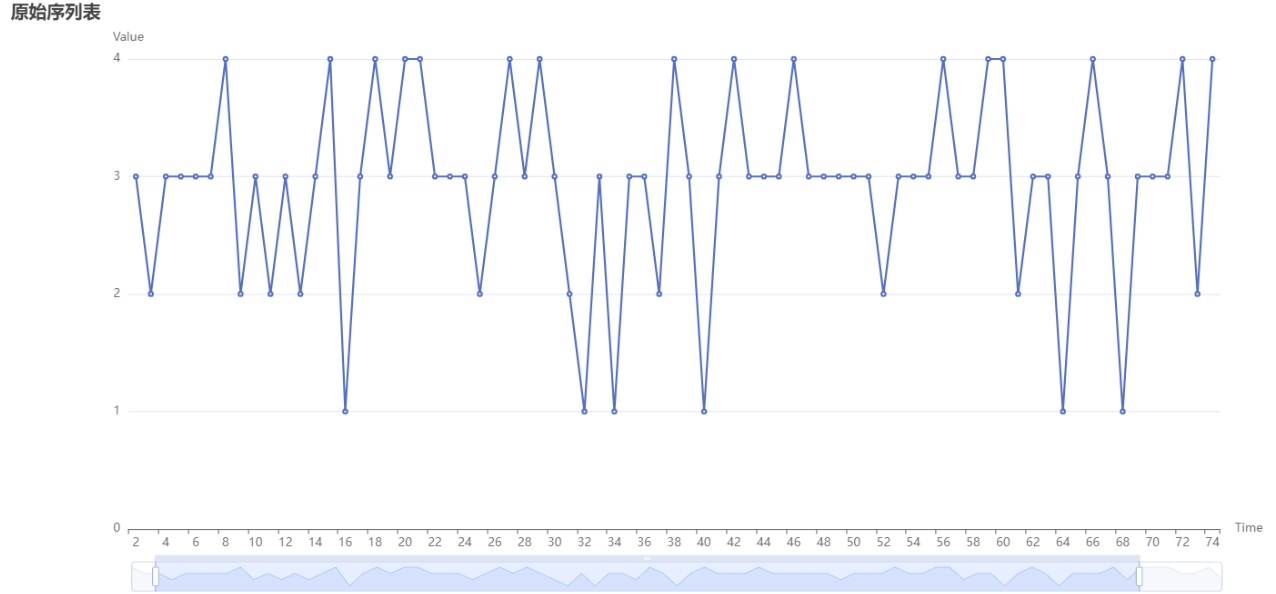
The above figure shows the original image without differentiation. The X-axis represents the time term, and the Y-axis represents the numerical value.
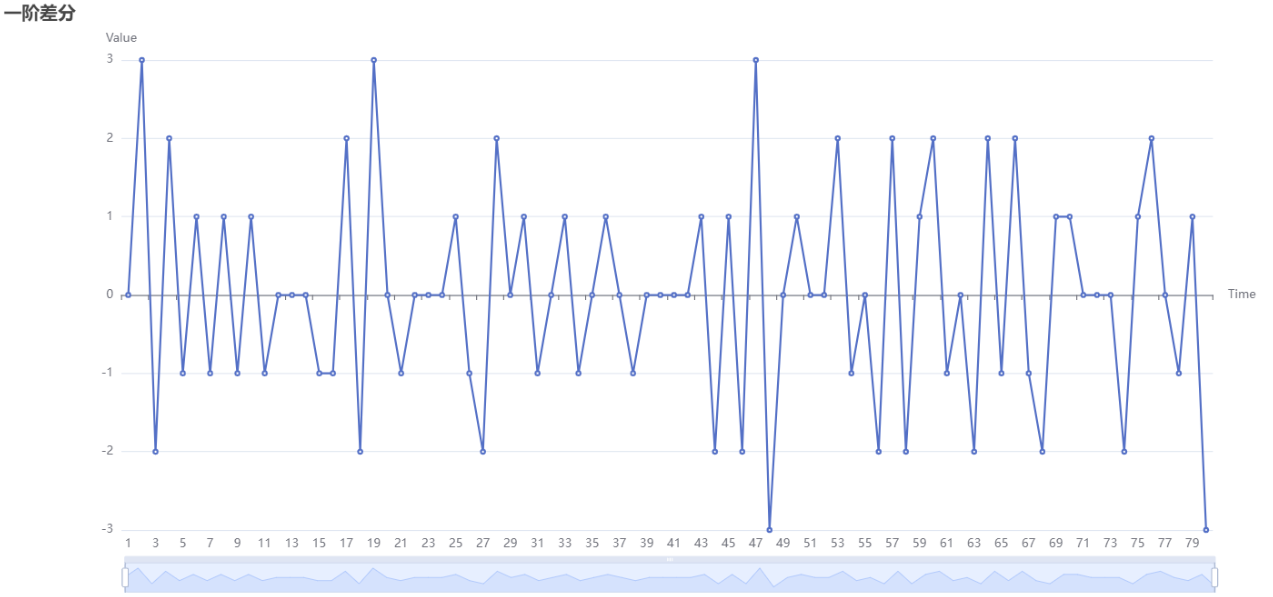
The above figure shows the original image without differentiation. The X-axis represents the time term, and the Y-axis represents the numerical value. The above figure shows the results of conducting a first-order difference. When the time intervals are equal, subtract the previous value from the next value to obtain a first-order difference.
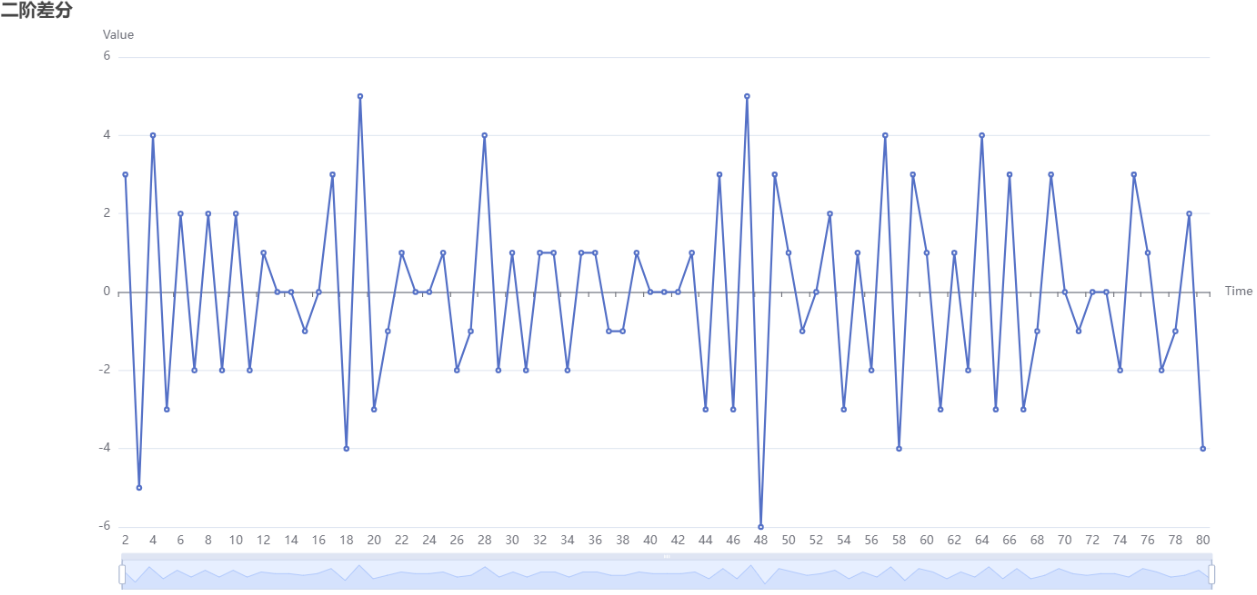
The above figure shows the results of performing second-order difference. Doing the same action twice, that is, subtracting the last value from the first order difference again, is called a "second order difference".
关注微信公众号发送【示例数据】获取SPSSMAX练习示例数据。
