Diverse Ben Friedman Friedman Test
The Friedman test, also known as the "Friedman bidirectional rank variance analysis," is a statistical test for the homogeneity of multiple (correlated) samples. The prerequisite requirements for the Friedman test are: 1. Sequential level data; 2. Three or more groups; 3. Relevant groups; 4. Randomly select samples from paired values
Data description:

This study aims to investigate whether there are differences in variables that are not mentioned between A1, A2, and A3. The Friedman test is a non parametric statistical method used to compare differences between three or more relevant groups.
The main principle of the diversity based Friedman test is to convert the observed values into ranks and calculate the sum of ranks for each group. Evaluate the significance of differences by comparing the degree of variation of the total rank of groups. If the p-value is less than the pre-set significance level (usually set at 0.05), it can be considered that the differences between groups are statistically significant.
In this example, due to the p-value being greater than 0.05, we cannot conclude that A1, A2, and A3 have significant differences in unmentioned variables overall.
In this example, a multi sample Friedman non parametric test was used to compare the differences in unmentioned variables among three groups (A1, A2, and A3).
The analysis results are as follows:
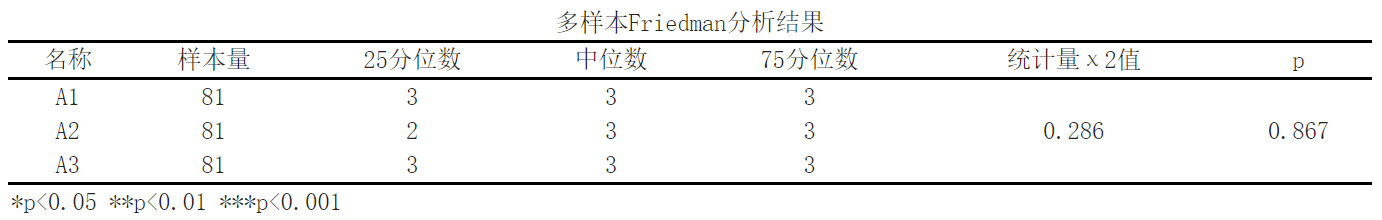
The analysis results are as follows: Friedman test is used to investigate whether there are significant differences between multiple paired quantitative data (and not normal). From the above table, it can be seen that the statistics between multiple sets of data χ The 2-value is 0.286, and the p-value is 0.867>0.05. There is no significant difference between the data of each group.
Based on the given results, we can draw the following conclusions:
statistic χ The 2-value is 0.286, and the p-value is 0.867. Due to a p-value greater than 0.05, we accept the original assumption that there is no significant difference between A1, A2, and A3 in the population.
Explanation of output indicators:
1.Sample size: The number of samples in each group. In this example, each group has 81 samples.
2.25th percentile: For each group, the 25th percentile for variables not mentioned is given. For example, in group A1, the 25th percentile of the variable is 3.
3.Median: For each group, the median of unmentioned variables is given. For example, in group A1, the median of the variable is 3.
4.75th percentile: For each group, the 75th percentile for variables not mentioned is given. For example, in group A1, the 75th percentile of the variable is 3.
5.statistic χ 2-value: This value is a statistic used in Friedman analysis. It measures the changes in the ranking of each group. In this example, the statistics χ The 2 value is 0.286.
6.P-value: The p-value of Friedman analysis is used to determine whether the differences between the three groups are statistically significant. In this example, the p-value is 0.867.
Reference:
[1]郑家亨.统计大辞典:中国统计出版社,1995年03月第1版:第218页
[2](美)V.F.夏普.社会科学统计学:科学技术文献出版社,1990年02月第1版
[3]陶澍.应用数理统计方法:中国环境科学出版社,1994年08月第1版
关注微信公众号发送【示例数据】获取SPSSMAX练习示例数据。
