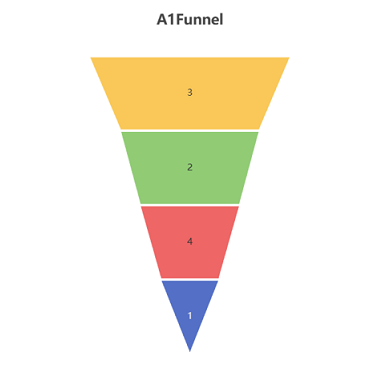
Funnel Plot
A funnel chart is a chart used to display data flow or stages. It consists of horizontal bars of different widths, each representing a stage or step. The width of the funnel plot reflects the amount or proportion of data in each stage. Funnel charts can help us identify bottlenecks, conversion rates, and trends in data processes, and are commonly used in sales and marketing fields.
Data description:
Background description:
The background description should indicate the source and collection method of funnel plot data. This helps readers understand the reliability and accuracy of the data, as well as the time range and sampling method of the data. The background explanation should explain the shape and proportion of the funnel. The proportional relationship between the width and height of the funnel can affect the relative magnitude of the data and the comparison results.
The analysis results are as follows:
关注微信公众号发送【示例数据】获取SPSSMAX练习示例数据。
