Granger Causality Test
Granger causality test is used to determine whether there is a causal relationship between two time series variables. It makes judgments based on whether a variable can provide additional information about the past value of another variable.
The Granger causality test is based on time series data and infers by comparing the impact of one variable on another at different time points. In this Granger causality test result table, we conducted Granger causality tests on paired samples A1 and A2.
The analysis results are as follows:
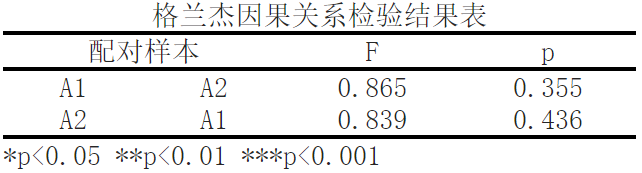
Based on variables A1 and A2, the significance P-value is 0.355>0.05, which does not show significance and cannot reject the original hypothesis, indicating that A1 cannot cause a change in A2.
Based on variables A2 and A1, the significance P-value is 0.436>0.05, which does not show significance and cannot reject the original hypothesis, indicating that A2 cannot cause a change in A1.
Firstly, we observe the effect of A1 as the independent variable on A2 as the dependent variable. According to paired sample data, the causal effect of A1 on A2 is 0.865, corresponding to a p-value of 0.355. This means that in this observation sample, the impact of A1 on A2 is not statistically significant.
Next, we observe the effect of A2 as the independent variable on A1 as the dependent variable. According to paired sample data, the causal effect of A2 on A1 is 0.839, corresponding to a p-value of 0.436. Similarly, in this observation sample, the impact of A2 on A1 is not statistically significant.
Overall, this means that there is no significant Granger causality between A1 and A2 in our observed samples. Granger causality test is a causal inference method based on time series data, which determines whether there is a causal relationship between variables by comparing their mutual effects. In this test result table, we found that the effects of A1 on A2 and A2 on A1 are not significant, so we cannot conclude that there is a causal relationship between these two variables.
Reference:
[1]Granger, C. W. J. (1969). Investigating causal relations by econometric models and cross-spectral methods. Econometrica, 37(3), 424-438.
[2]Lütkepohl, H. (2006). New introduction to multiple time series analysis. Springer Science & Business Media.
[3]Box, G. E., & Jenkins, G. M. (2016). Time series analysis: Forecasting and control. John Wiley & Sons.
[4]Enders, W. (2014). Applied econometric time series. John Wiley & Sons.
[5]Hamilton, J. D. (1994). Time series analysis. Princeton University Press.
关注微信公众号发送【示例数据】获取SPSSMAX练习示例数据。
