Hierarchical Regression
Hierarchical regression is a statistical analysis method used to solve data analysis problems where samples have a hierarchical structure. In hierarchical regression, data is divided into different levels or groups, with individuals within each level having similar characteristics or attributes.
The hierarchical regression method adjusts the parameter estimation and inference methods of the regression model based on the characteristics of the data structure. By considering the hierarchical structure, hierarchical regression can more accurately estimate parameters, test effects, and make predictions.
Data description:
Background description:
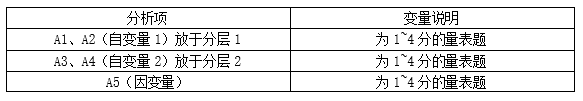
In this study, we focused on the impact of indicators A1, A2, A3, and A4 on the dependent variable A5. These indicators are data obtained through 1-5 scale questions to evaluate participants' attitudes or perspectives towards a specific issue. To analyze the relationship between these variables, we used a hierarchical regression method. Layered regression is a statistical analysis method that can simultaneously consider the impact of multiple independent variables on the dependent variable, and organize and analyze the independent variables according to different levels. Specifically, in our study, we placed the independent variables A1 and A2 in the first layer, which means that they may directly affect the dependent variable A5. The independent variables A3 and A4 are placed in the second layer, and we assume that they affect the dependent variable A5 through some mediating mechanism.
The analysis results are as follows:
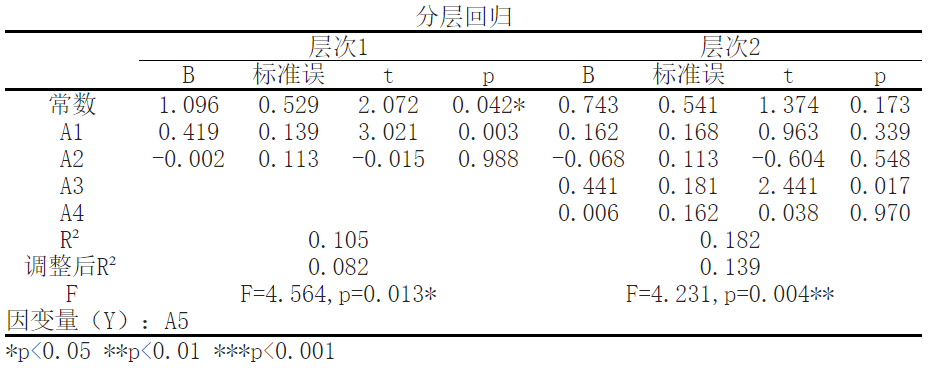
The results showed that with A5 as the dependent variable and ['A1 ',' A2 '] as the independent variable, a multiple regression model was established for the independent and dependent variables. R2 (RSsquare) represents the degree of explanation of the independent variable for the dependent variable variation in the regression model, which is the beginning of analyzing the regression results. The data shows that; The R-squared value of the model is 0.1048, which means that ['A1 ','A2'] can explain the 10.48% change in A5. The regression effect of the regression model can be judged through the F-test, which tests whether the linear relationship between the dependent variable and all independent variables is significant, and can also be used to test the statistical significance of the model. According to the results, the F value is 4.564, the P value is 0.013, and the model formula is: A5=1.096+0.419 * A1-0.002 * A2. A1 has a significant positive effect on A5, with a beta value of 0.419 and a p-value of 0.0034 (p<0.05).
The results showed that with A5 as the dependent variable and ['A1 ','A2','A3 ','A4'] as the independent variable, a multiple regression model was established for the independent and dependent variables. R2 (RSsquare) represents the degree to which the independent variable explains the variation of the dependent variable in the regression model, which is the beginning of analyzing the regression results. The data shows that; The R-squared value of the model is 0.1821, which means that ['A1 ','A2','A3 ','A4'] can explain the 18.21% change in A5. The regression effect of the regression model is judged through the F-test, which tests whether the linear relationship between the dependent variable and all independent variables is significant, and can also be used to test the statistical significance of the model. According to the results, the F value is 4.231, the P value is 0.004, and the model formula is: A5=0.743+0.162 * A1-0.068 * A2+0.441 * A3+0.006 * A4. A3 has a significant positive effect on A5, with a beta value of 0.4406 and a p-value of 0.017 (p<0.05).
Attention needs to be paid to R ² And adjusted R ²。 They are used to evaluate the explanatory power of regression models, which are 0.105 and 0.082 (first layer) and 0.182 and 0.139 (second layer), respectively. This indicates that the independent variable explains a certain proportion of the overall variance, but there are still some unexplained variances present.
关注微信公众号发送【示例数据】获取SPSSMAX练习示例数据。
