Independence Weight Coefficient Method
The independence weight coefficient method is a method used to compare the degree of independence between two categorical variables. It determines the correlation between two variables by calculating the independence weight coefficient (also known as chi square independence test). This method is usually used to analyze the correlation between two categorical variables, such as whether there is a correlation between gender and occupation.
Background description:
The independence weight coefficient method is a commonly used method for evaluating indicator weights, mainly used to determine whether there are significant differences between indicators and the contribution of each indicator to the overall indicator. It is calculated based on the average, standard deviation, and range of indicators. The higher the independence weight coefficient, the more independently the indicator can explain and influence the overall indicator. The independence weight coefficient method helps us understand the contribution level and relative independence of each indicator, and can be used to guide decision-making and evaluate the importance of indicators. In this analysis, we can determine which indicators have the greatest impact on the overall indicators and which indicators should be considered when formulating strategies and plans.
The analysis results are as follows:
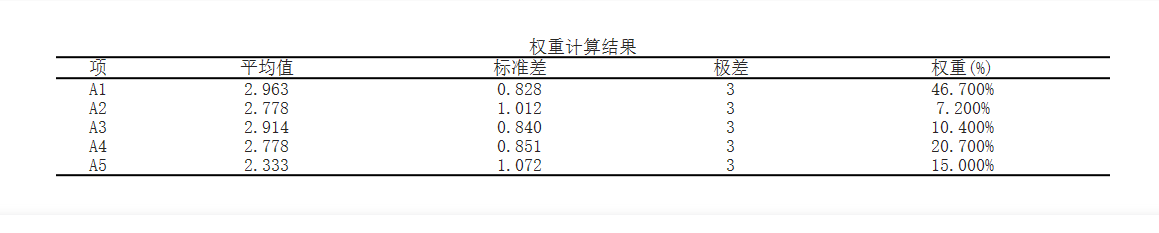
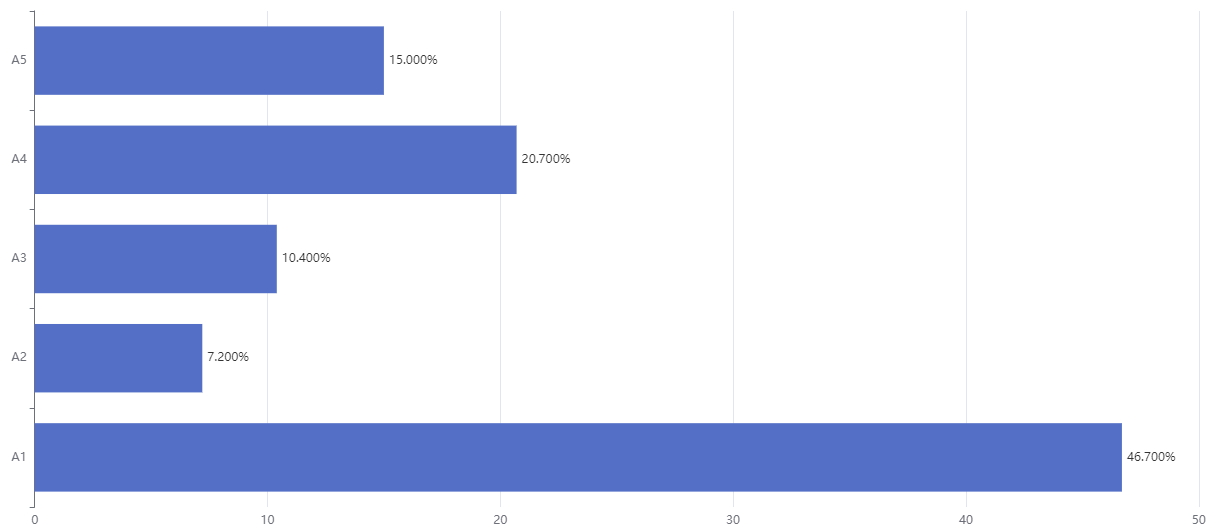
Based on the above calculation results, we can see that the weight of indicator A1 is the highest, reaching 46.700%. The weights of indicators A2, A3, A4, and A5 are 7.200%, 10.400%, 20.700%, and 15.000%, respectively. This indicates that in this analysis, indicator A1 has the greatest contribution to the overall indicator, while indicator A2 has the smallest contribution. The contribution of indicators A3, A4, and A5 is relatively high, but there are still differences.
SPSSMAX also outputs a histogram of indicator importance:
关注微信公众号发送【示例数据】获取SPSSMAX练习示例数据。
