Independent-Sample T Test
T-test, also known as student's t-test, is mainly used for small sample sizes (such as n<30) and overall standard deviation σ Unknown normal distribution is the use of t-distribution theory to infer the probability of differences occurring and compare whether the differences between two averages are significant.
Data description:

Background description:
Independent sample t-test is a statistical method used to compare the differences between two independent samples. By comparing the average, t-value, and p-value of different groups in each analysis item, it can be determined whether there is a significant difference between the two groups.
Analysis items with lower p-values indicate significant differences between the two groups, while analysis items with higher p-values indicate no significant differences between the two groups. These analysis results can help researchers understand the differences in various analysis items between different groups and provide statistical basis to support or overturn these differences. Independent sample t-tests are commonly used to compare differences between different treatment groups, populations, or conditions. These analysis results are crucial for conducting group comparisons and studying group differences.
The results show:
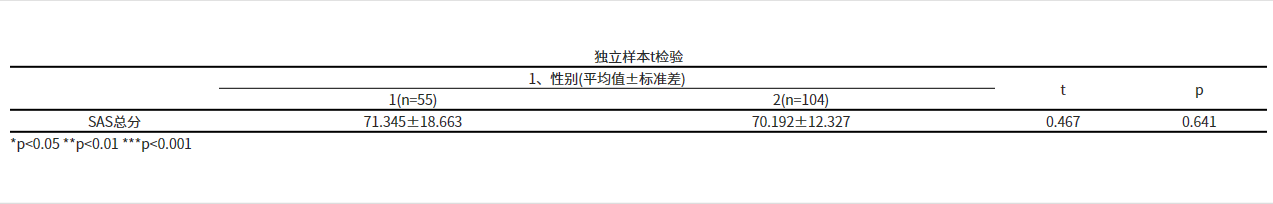
As can be seen from the above table, the t-test (all known as independent samples t-test) was used to study the differences in SAS total scores between different genders, as can be seen from the above table: the t-value of group 1.0 and group 2.0 is 0.467, and the p-value is 0.641, which indicates that there is no significant difference between the data of the two groups (p> 0.05), in which the first group's sample size is 55, the mean is 31.345, and the standard deviation is 18.663; the second group's sample size is 104, the mean is 70.192, and the standard deviation is 12.327; the mean difference of the data of the two groups is 1.153. The sample size of the first group is 55, the mean value is 31.345, and the standard deviation is 18.663; the sample size of the second group is 104, the mean value is 70.192, and the standard deviation is 12.327; and the difference between the means of the two groups of data is 1.153.
SPSSMAX also provides another format for displaying results:
Interpretation of Result Parameters:
1. Analysis item: Refers to each analysis item that needs to undergo independent sample t-test.
2. Item: represents each sub item in the analysis item.
3. Sample size: The sample size of two independent samples in each analysis item.
4. Mean: The average value of each independent sample.
5. Standard deviation: The standard deviation of each independent sample, used to measure the degree of variation in the data.
6. Mean difference: The difference between the average values of two independent samples.
7. 95% CI Low and 95% CI High (Difference 95% Confidence Interval Low and High): The 95% confidence interval calculated based on the estimation and standard error of the difference, representing the confidence range of the mean difference.
8. T-value: A statistical indicator used in independent sample t-tests to measure the significance of differences between two independent samples.
DF (Degrees of Freedom): The degree of freedom in the independent sample t-test, used to calculate the probability of the t-distribution.
10. P-value: A statistical indicator in the independent sample t-test that represents the significance of the difference between two independent samples.
Reference:
[1]Fisher Box, Joan. Guinness, Gosset, Fisher, and Small Samples. Statistical Science. 1987, 2 (1): 45–52.
[2]尹希果主编.计量经济学原理与操作:重庆大学出版社,2009.09:37
[3]陈望忠主编.医学中英文论文写作与编辑:军事医学科学出版社,2007.7:159
[4]O'Connor, John J.; Robertson, Edmund F., Gosset, MacTutor History of Mathematics archive
[5]刘江涛,刘立佳编著.SPSS数据统计与分析应用教程 基础篇:清华大学出版社,2017.01:61-65
[6]雷蕾著.应用语言学研究设计与统计:华中科技大学出版社,2016.03:57
关注微信公众号发送【示例数据】获取SPSSMAX练习示例数据。
