Linear Regression
Linear regression is a statistical analysis method that uses regression analysis in mathematical statistics to determine the quantitative relationship between two or more variables that are interdependent. Its expression is y = w'x+e. E is a normal distribution with a mean of 0 for the error. It is used to analyze the dependency relationships between variables, especially the variation patterns between variables, which is the key aspect of its investigation. The relationship between these variables is ultimately described and reflected through regression equations, enabling people to accurately understand the degree to which a variable is affected by other variables, and thus providing reliable basis for prediction.
Data description:

Background description:
Linear regression is a commonly used statistical analysis method used to explore the linear relationship between independent and dependent variables. In this analysis, we used 81 observation samples for linear regression analysis to investigate the impact of independent variables (A1, A2, A3, A4, and A5) on the dependent variable (SAS total score). In this analysis, we used 81 observation samples for linear regression analysis to investigate the impact of independent variables (A1, A2, A3, A4, and A5) on the dependent variable (SAS total score).
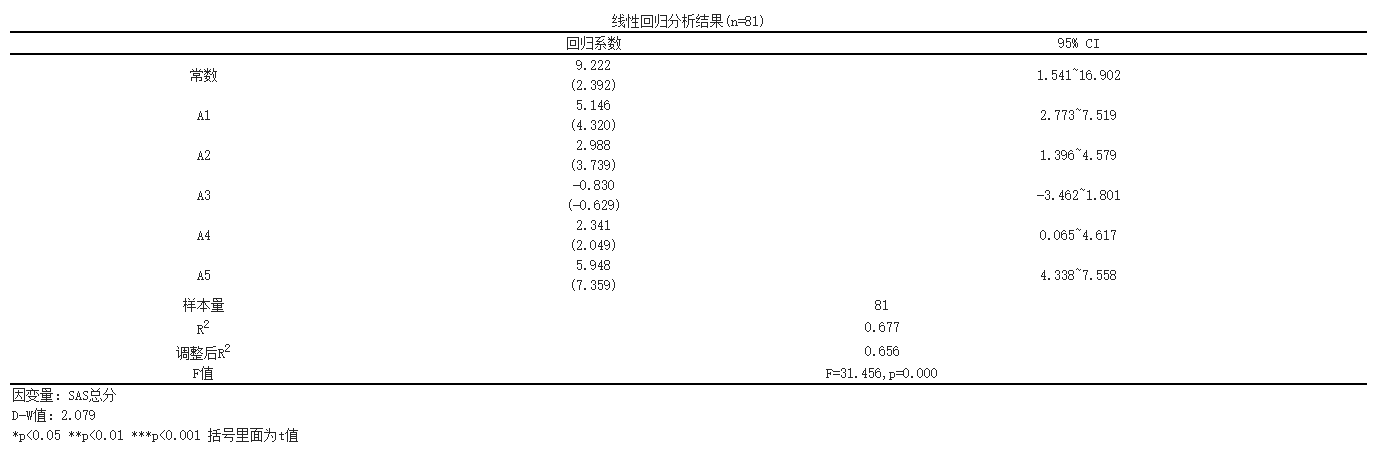
The analysis results are as follows:

The results showed that using SAS total score as the dependent variable and ['A1 ','A2','A3 ','A4','A5 '] as the independent variable, a multiple regression model was established for the independent and dependent variables. R2 (RSsquare) represents the degree to which the independent variable explains the variation of the dependent variable in the regression model, which is the beginning of analyzing the regression results. The data display; The R-squared value of the model is 0.6771, which means that ['A1 ','A2','A3 ','A4','A5 '] can explain the 67.71% change in SAS total score. The regression effect of the regression model can be judged through the F-test, which tests whether the linear relationship between the dependent variable and all independent variables is significant, and can also be used to test the statistical significance of the model. According to the results, the F-value is 31.456, the P-value is 0.0, and the model formula is: SAS total score=9.222+5.146 * A1+2.988 * A2-0.83 * A3+2.341 * A4+5.948 * A5.
SPSSMAX also provides output results in another format:
Reference:
[1] Cohen, J., Cohen P., West, S.G., & Aiken, L.S. Applied multiple regression/correlation analysis for the behavioral sciences. Hillsdale, NJ: Lawrence Erlbaum Associates. 2003.
[2] Draper, N.R. and Smith, H. Applied Regression Analysis. Wiley Series in Probability and Statistics. 1998.
[3] 孙荣恒.应用数理统计(第三版).北京:科学出版社,2014:204-206
[4] alton, Francis. Regression Towards Mediocrity in Hereditary Stature (PDF). Journal of the Anthropological Institute. 1886, 15: 246–263
关注微信公众号发送【示例数据】获取SPSSMAX练习示例数据。
