Mann Whitney Test
The Mann Whitney test, also known as the "Mann Whitney rank sum test," is also known as the Mann Whitney U-test,. It assumes that two samples come from two populations that are identical except for the population mean, with the aim of testing whether there is a significant difference in the mean between these two populations. It can be seen as a substitute for the T-test or corresponding large sample normal test for parameter testing of the difference between two means. When it is necessary to test whether multiple samples come from identical populations other than the population mean, it can also be used.
This study aims to investigate whether there are gender differences between groups A1 and A2. The Mann Whitney test is a non parametric statistical method used to compare the differences between two independent groups. This method does not rely on the distribution assumption of the data, so it is suitable for non normally distributed data.
The main principle of the Mann Whitney test is to convert observations into ranks and evaluate the significance of differences by comparing the sum of ranks between two groups. If the p-value is less than the pre-set significance level (usually set at 0.05), it can be considered that the difference between the two groups is statistically significant. In this example, due to the p-values being greater than 0.05, we cannot conclude that there is a significant difference between A1 and A2 and gender in the overall population.
The grouping variable was gender, and the dependent variable was A1.A2 for the Mann Whitney test. The results are as follows:
The following are various commonly used methods for generating variables:
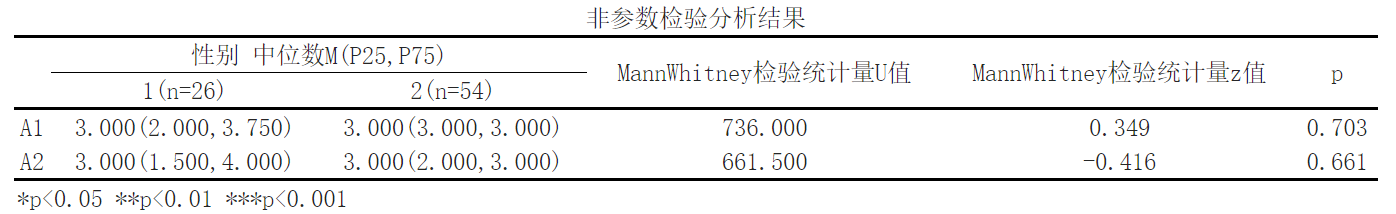
Using non parametric tests to study the gender differences of A1, it can be seen from the above table that Mann Whitney_ The U-statistic value is 736.0, and the p-value is 0.703>0.05, which means that the original assumption is accepted, indicating that there is no significant difference in A1 between the two groups in the overall population.
Using non parametric tests to study the gender differences of A2, it can be seen from the above table that Mann Whitney_ The U-statistic value is 661.5, and the p-value is 0.661>0.05, indicating that there is no significant difference in A2 between the two groups in the overall population.
Detailed explanation of output indicators:
1.Median M (P25, P75): For each group, the median of the variable (not mentioned) and its lower quartile (P25) and upper quartile (P75) are given. For example, in group A1, the median of the variable is 3.000, the lower quartile is 2.000, and the upper quartile is 3.750.
2.MannWhitney test statistic U-value: This value is the statistic used in the Mann Whitney analysis. It measures the rank difference between two groups. In group A1, the U-value is 736.000, while in group A2, the U-value is 661.500.
3.MannWhitney test statistic z-value: This value is the z-score that converts the U-value into a standard normal distribution. In group A1, the z-value is 0.349, and in group A2, the z-value is -0.416.
4.P-value: The p-value of Mann Whitney analysis is used to determine whether the difference between two groups is statistically significant. In group A1, the p-value is 0.703, and in group A2, the p-value is 0.661.
Reference:
[1]Ken Black.Business Statistics: Contemporary Decision Making.John Wiley and Sons, 2009.ISBN:0470409010, 9780470409015
[2] 高惠璇.应用多元统计分析[M].北京:北京大学出版社,2005.
关注微信公众号发送【示例数据】获取SPSSMAX练习示例数据。
