Mediation Effect Analysis
The mediating effect test is a method used to determine whether the mediating variable between the cause variable and the outcome variable plays a role between the two variables. Mediating variables are variables used to explain the relationship between cause variables and outcome variables, also known as path variables. They reveal how cause variables affect outcome variables, analyze the impact of cause variables on mediating variables, and analyze the impact of mediating variables on outcome variables.
Data description:

Mediation analysis is a statistical method used to study the mechanism of a variable (intermediary variable) in explaining the relationship between independent and dependent variables. It can help determine the degree to which mediating variables explain the relationship between the dependent variable and the independent variable, as well as the magnitude of direct and indirect effects.
The analysis results are as follows:
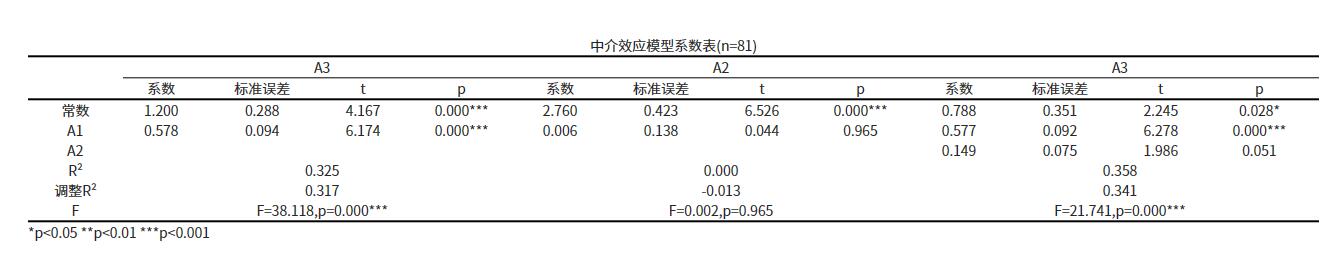
In model 1, the independent variable A1 is regressed on the dependent variable A3 and there is a significant positive effect of A1 on A3 with a beta value of 0.5783 and a p-value of 0.0 (p<0.05). The model equation is: A3 = 1.2002 + 0.5783*A1.
In model 1, the independent variable A1 is regressed on the dependent variable A3 and there is a significant positive effect of A1 on A3 with a beta value of 0.5783 and a p-value of 0.0 (p<0.05). The model equation is: A3 = 1.2002 + 0.5783*A1.
In model three, the independent variable A1, mediator variable A2 and dependent variable A3 were regressed and there was a significant positive effect of A1 on A3 with a beta value of 0.5774 and a p-value of 0.0 (p<0.05). The model formula is: A3 = 0.7878 + 0.5774*A1 + 0.1494*A2.
Coefficients: coefficients indicate the strength of the relationship between the independent and dependent variables. In this model, the coefficient between independent variable A1 and dependent variable A3 is 0.577, and the coefficient between independent variable A2 and dependent variable A3 is 0.149.
Standard Error: the standard error is a measure of the uncertainty of the coefficient estimates. It measures how accurate the coefficient estimates are. In this model, the standard error between independent variable A1 and dependent variable A3 is 0.092 and the standard error between independent variable A2 and dependent variable A1 is 0.075.
t-value: t-value indicates the degree of difference between the coefficient estimates and zero, and the t-test is used to confirm the existence of a significant relationship. In this model, the t-value between independent variable A1 and dependent variable A3 is 6.278 and the t-value between independent variable A2 and dependent variable A1 is 1.986.
p-value: p-value indicates the probability of an observed difference or more extreme difference under the null hypothesis. In this model, the p-value between independent variable A1 and dependent variable A3 is 0.000, and the p-value between independent variable A2 and dependent variable A3 is 0.051.
- R²: R² is a measure of how well the independent variables explain the variation in the dependent variable throughout the model. In this model, R² is 0.358, indicating that the independent variable explains 35.8% of the variation in the dependent variable.
Adjusted R²: Adjusted R² is a correction to R² that takes into account the effect of the number of independent variables and sample size on the level of explanation. In this model, the adjustment R² is 0.341.

The results showed that the 95% BootCI confidence interval for path A1=>A2=>A3 was (-0.062,0.039), including 0, indicating that the mediation effect of this path was not significant, i.e., A2 did not play a significant mediating role in A1 and A3, with a total effect value of 0.006 and mediation effect value of 0.086.
Item: refers to the mediating path, i.e., A1 indirectly affects A3 through A2 as a mediating variable.
c total effect: c total effect represents the total effect of independent variable A1 on dependent variable A3, i.e., the cumulative effect through direct and indirect paths. In this model, the c total effect is 0.006.
a: a denotes the direct effect of the independent variable A1 on the mediating variable A2. In this model, a is 0.578.
b: b indicates the direct effect of the mediating variable A2 on the dependent variable A3. In this model, b is 0.149.
Direct effect: direct effect refers to the effect of the independent variable on the dependent variable without going through the mediating variable. In this model, the direct effect is 0.086.
Indirect effect: Indirect effect refers to the effect of the independent variable indirectly affecting the dependent variable through the mediating variable. In this model, the indirect effect is -0.080.
a*b(95% BootCI): indicates the confidence interval of a*b, calculated by the self-help method (bootstrap). In this model, the 95% confidence interval for a*b is -0.062 to 0.039.
Conclusion of the test: after the mediation analysis, we can conclude that the mediation is not significant because the confidence interval of a*b contains 0. This means that the mediating variable A2 does not have a significant effect on the relationship between the independent variable A1 and the dependent variable A3.
Reference:
[1] 《西方心理学史》叶浩生主编 人民教育出版社出版 P233
[2] 林崇德,杨治良,黄希庭.心理学大词典:上海教育出版社,2003
[3]温忠麟;叶宝娟. (2014). 中介效应分析:方法和模型发展. 心理科学进展 , 22(5), 731-745.
[4] 蔡华俭, 张明杨, 包寒吴霜, 朱慧珺, 杨紫嫣, 程曦, 黄梓航, 王梓西. 心理学视野下的社会变迁研究:研究设计与分析方法[J]. 心理科学进展, 2023, 31(2): 159-172.
[5] 温忠麟, 方杰, 谢晋艳, 欧阳劲樱. 国内中介效应的方法学研究[J]. 心理科学进展, 2022, 30(8): 1692-1702.
关注微信公众号发送【示例数据】获取SPSSMAX练习示例数据。
