Multiple Responses
The multiple response method is a statistical technique used to analyze multiple correlated response variables. In many studies and practical applications, we often face multiple response variables, while traditional statistical methods may only be able to handle a single response variable. The multiple response method provides a method that can simultaneously consider multiple response variables, thereby gaining a more comprehensive understanding of the relationships and impacts between variables.
Data description:

Background description:
Multiple response analysis is a data analysis method used to analyze the response of multiple topics. In multiple topic selection, respondents can choose multiple options as answers. Multiple response analysis aims to analyze the selection and proportion of each option, and provide information about the response patterns and characteristics of multiple topics. Through multiple response analysis, we can understand the audience groups of different options and their preferences and tendencies.
In the multiple response frequency analysis table provided below, we can see the response status of each question item for a certain problem or topic with multiple selected topics. For each question item, we recorded the number of respondents who chose the option (N), as well as the corresponding response rate and popularity rate.
The response rate represents the proportion of respondents who choose this option, obtained by dividing the number of respondents who choose this option by the total number of respondents (N). The penetration rate represents the percentage of respondents who choose this option as a whole, obtained by dividing the number of respondents who choose this option by the total number of respondents and multiplying it by 100.
The analysis results are as follows:
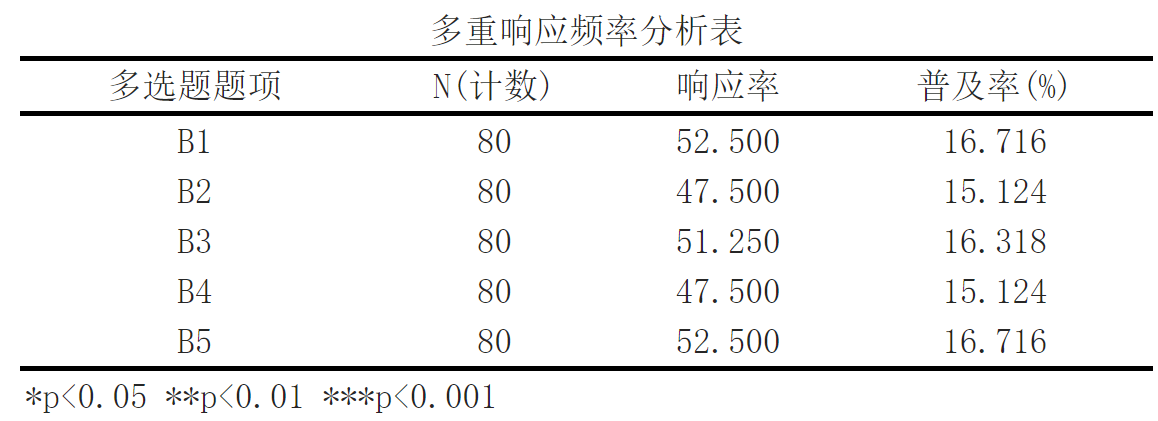
In the given multiple response frequency analysis table, we can see the count (N), response rate, and popularity of each option. The response rate can help us understand the frequency at which each option is selected; Popularity can help us understand the distribution of each option relative to the overall respondents.
It can be seen that the B1 and B5 options have a higher penetration rate, followed by the B3 option, and finally the B2 and B4 options.
关注微信公众号发送【示例数据2】获取SPSSMAX练习示例数据2。
