NPS Net Recommended Value
NPS Net Promoter Score is an evaluation indicator used to measure customer satisfaction and loyalty. It was proposed by Fred Reichheld, the founding partner of management consulting firm Bain&Company, in 2003 and has been widely used in market research and customer relationship management.
By regularly measuring NPS and tracking its changes, companies can understand the dynamic trends in user satisfaction and develop relevant strategies based on the results. This can help businesses enhance user relationships, increase user loyalty, drive growth, and improve products or services.
Data description:

Background description:
The statistical table used for NPS (Net Promoter Score) net recommendation value analysis in this study. NPS is a commonly used measure of customer satisfaction, used to evaluate consumers' willingness to recommend a product, service, or brand. NPS measures and predicts customer loyalty and recommendation behavior by dividing consumers into three categories, namely detractors, passives, and promoters.
The three categories are as follows:
Detractors are respondents who give a rating of 1 to 6, expressing dissatisfaction or even anger with the product, service, or brand, and may spread negative word-of-mouth.
Passives are respondents who give a rating of 7 or 8, indicating that they are relatively satisfied with the product, service, or brand, but their loyalty and willingness to recommend are relatively low, making them susceptible to the influence of competing brands.
Promoters are respondents who give a rating of 9 or 10, indicating that they are very satisfied with the product, service, or brand and are willing to actively recommend it to others. They are usually loyal brand supporters.
The NPS net recommendation value is obtained by subtracting the percentage of detractors from the percentage of recommenders, with a range of -100 to+100A higher NPS value indicates higher loyalty and positive recommendation tendencies, while a lower NPS value indicates the possibility of higher dissatisfaction and negative recommendation tendencies.
In summary, NPS net recommendation value analysis is used to measure consumers' willingness and loyalty to recommend. By dividing respondents into three categories: detractors, passives, and recommenders, and calculating the percentages and differences among them, it helps companies understand and evaluate their customer satisfaction levels, and develop corresponding improvement and marketing strategies.
The analysis results are as follows:
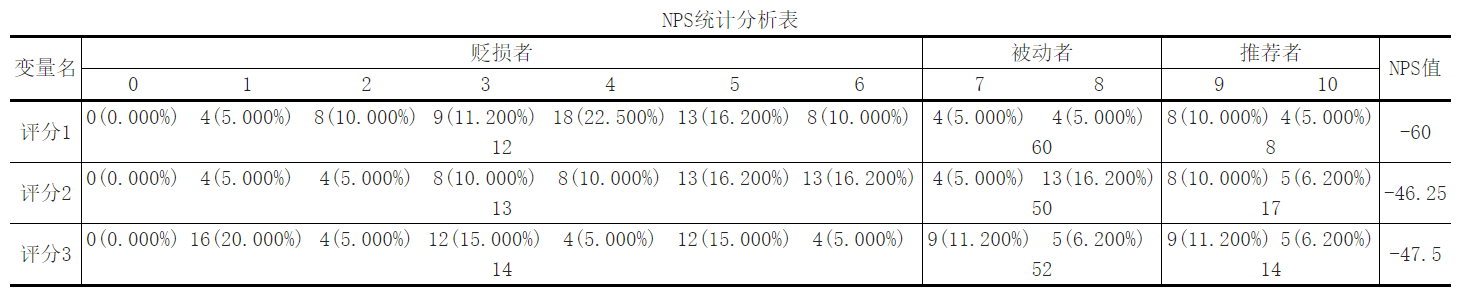
The NPS value is calculated by subtracting the percentage of recommenders from the percentage of detractors. In this table, the NPS value column displays the NPS net recommended value obtained through the corresponding calculation formula. For example, in a rating of 1, an NPS value of -60 indicates that the percentage of detractors in this rating option is much higher than the percentage of recommenders, which may result in high dissatisfaction and negative word-of-mouth.
In this table, each column represents a scoring option, ranging from 1 to 10. The first line is the count (N) of each scoring option and the percentage of that scoring option. For example, in a rating of 1, there are 0 detractors (0.000%), 4 passives (5.000%), and 8 recommenders (10.000%).
关注微信公众号发送【示例数据2】获取SPSSMAX练习示例数据2。
