Normality Test
Normal distribution, also known as normal distribution, is a type of probability distribution for continuous random variables, where the peak of the normal curve is located at the center, where the mean is located. A normal curve is centered on the mean, symmetrical left and right, and the two ends of the curve never intersect with the horizontal axis. The normal curve starts at the location of the mean and gradually decreases uniformly towards the left and right sides. The total area between the curve and the horizontal axis is equal to 1, which is equivalent to the probability density function. The probability of integrating from positive infinity to negative infinity is 1.
Normality testing is used to check whether data follows a normal distribution. In statistics, a normal distribution is a common probability distribution with a symmetric bell shaped curve. Understanding whether the data conforms to a normal distribution is crucial for determining appropriate statistical analysis methods and interpreting analysis results.
Data description:
Background description:
These data provide the mean, standard deviation, skewness, kurtosis of different samples (A1-A5), as well as the Kolmogorov Smirnov test p-values and Shapiro Wilk test p-values obtained from normality testing. These data may come from measurements or observations of a specific variable, and conducting a normality test before statistical analysis can help understand the distribution of the data and select appropriate statistical methods for further analysis and interpretation. Based on the given p-value, we can infer that these sample data do not conform to a normal distribution in a statistical sense.
The results show:
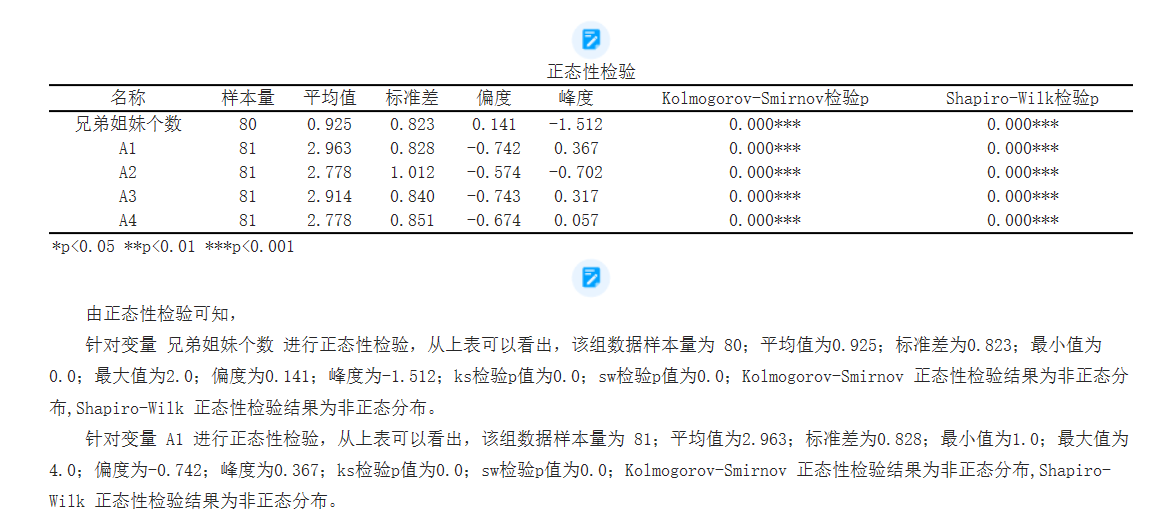
According to the normality test,
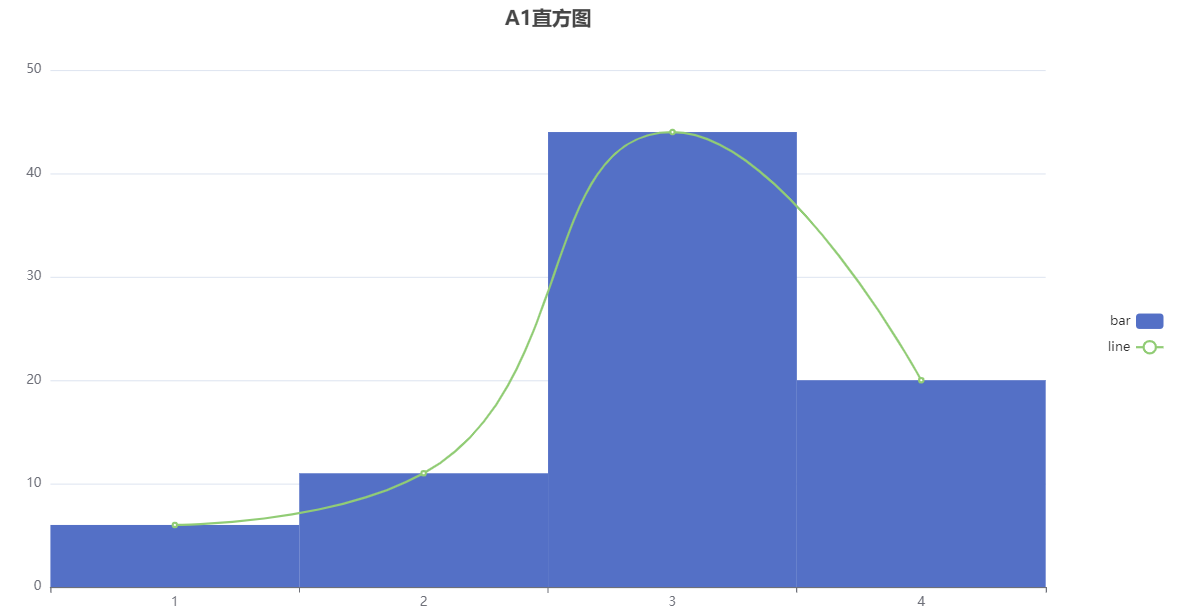
The normality test was conducted on variable A1, and it can be seen from the above table that the sample size of this group of data is 81; The average value is 2.963; The standard deviation is 0.828; The minimum value is 1.0; The maximum value is 4.0; The deviation is -0.742; The kurtosis is 0.367; The p-value of ks test is 0.0; The p-value of the sw test is 0.0; The Kolmogorov Smirnov normality test results are non normal distributions, while the Shapiro Wilk normality test results are non normal distributions.
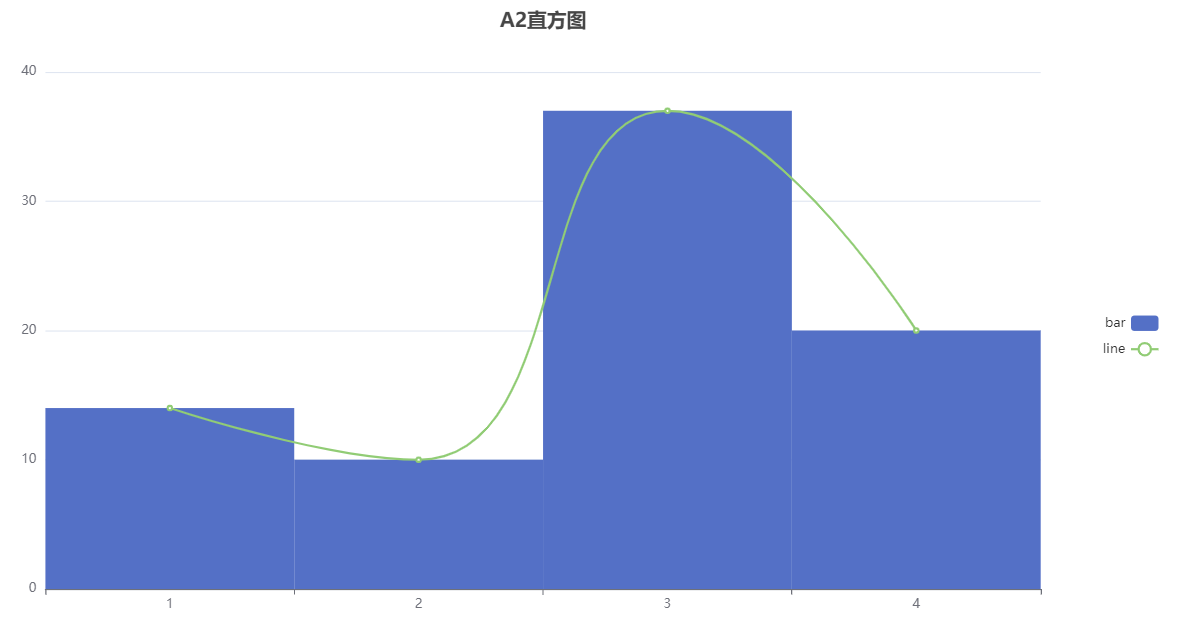
The normality test was conducted on variable A2, and it can be seen from the above table that the sample size of this group of data is 81; The average value is 2.778; The standard deviation is 1.012; The minimum value is 1.0; The maximum value is 4.0; The skewness is -0.574; The kurtosis is -0.702; The p-value of ks test is 0.0; The p-value of the sw test is 0.0; The Kolmogorov Smirnov normality test results are non normal distributions, while the Shapiro Wilk normality test results are non normal distributions.
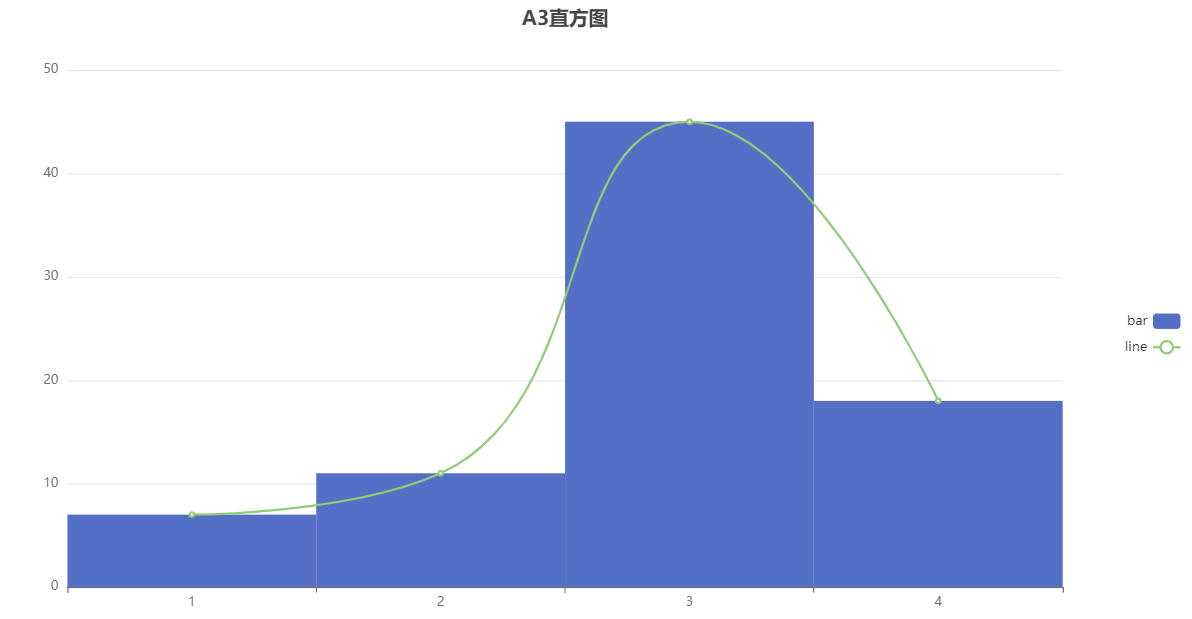
The normality test was conducted on variable A3, and it can be seen from the above table that the sample size of this group of data is 81; The average value is 2.914; The standard deviation is 0.84; The minimum value is 1.0; The maximum value is 4.0; The skewness is -0.743; The kurtosis is 0.317; The p-value of ks test is 0.0; The p-value of the sw test is 0.0; The Kolmogorov Smirnov normality test results are non normal distributions, while the Shapiro Wilk normality test results are non normal distributions.
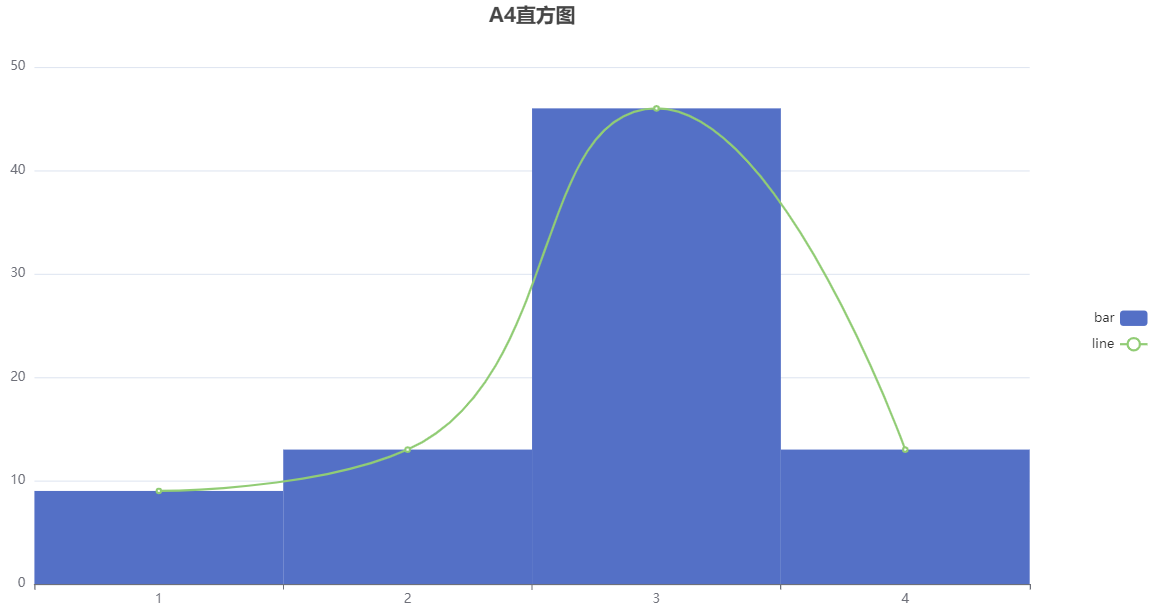
The normality test was conducted on variable A4, and it can be seen from the above table that the sample size of this group of data is 81; The average value is 2.778; The standard deviation is 0.851; The minimum value is 1.0; The maximum value is 4.0; The skewness is -0.674; The kurtosis is 0.057; The p-value of ks test is 0.0; The p-value of the sw test is 0.0; The Kolmogorov Smirnov normality test results are non normal distributions, while the Shapiro Wilk normality test results are non normal distributions.
The normality test was conducted on variable A4, and it can be seen from the above table that the sample size of this group of data is 81; The average value is 2.778; The standard deviation is 0.851; The minimum value is 1.0; The maximum value is 4.0; The skewness is -0.674; The kurtosis is 0.057; The p-value of ks test is 0.0; The p-value of the sw test is 0.0; The Kolmogorov Smirnov normality test results are non normal distributions, while the Shapiro Wilk normality test results are non normal distributions.
Interpretation of outcome indicators:
1.Interpretation of outcome indicators:
The analysis graph is as follows:
2.Mean: A measure of the concentrated trend of a set of data, representing the central position of the data.
3.Standard Deviation: A standard deviation is a measure of the degree of dispersion of a set of data, indicating the degree of dispersion of the data around the mean.
4.Skewness: Skewness is a measure of the symmetry of data distribution. Negative skewness indicates that the data distribution is skewed to the left, while positive skewness indicates that the data distribution is skewed to the right.
5.Kurtosis: Kurtosis is a measure of the steepness of a data distribution curve. The normal distribution has a kurtosis of 3, with values greater than 3 indicating higher kurtosis and values less than 3 indicating lower kurtosis.
6.Kolmogorov-Smirnov Test p-value:Kolmogorov-The Smirnov test is used to test whether data follows a theoretical distribution (such as a normal distribution). The p-value represents the probability of the difference between the observed data and the theoretical distribution.
7. The Smirnov test is used to test whether data follows a theoretical distribution (such as a normal distribution). The p-value represents the probability of the difference between the observed data and the theoretical distribution.
The analysis graph is as follows:
[1]杨松林主编,文科数学,苏州大学出版社,2015.01,第107页
[2]Shaou-Gang Miaou; Jin-Syan Chou. 《Fundamentals of probability and statistics》. 高立图书. 2012: 第147页.
[3]胡泳. 正态分布[J]. 商务周刊, 2009 (24): 94-94.
[4]Anderson T W, Anderson T W, Anderson T W, et al. An introduction to multivariate statistical analysis[M]. New York: Wiley, 1958.
关注微信公众号发送【示例数据】获取SPSSMAX练习示例数据。
