One Sample T-Test
One sample t-test is a test for the difference between a sample statistic and its population statistic, or theoretical value. For example, to compare the difference between sample mean and population mean, a single sample t-test can be used.
Data description:

Background description:
Single sample t-test is a commonly used hypothesis testing method in statistics, used to compare whether there is a difference between the sample mean and the known or expected population mean. We can determine whether there is a significant difference between the data and the test value. A variable with a large p-value (greater than 0.05) indicates no significant difference between the data and the test value, while a variable with a small p-value (less than 0.05) indicates a significant difference between the data and the test value. These analysis results can help researchers evaluate whether the data meets their expected assumptions and provide statistical basis to support or refute these assumptions.
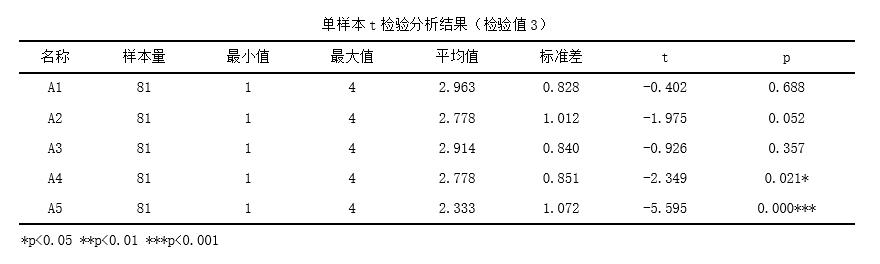
From the above table, it can be seen that using a single sample t-test to compare variable A1 with a test value of 3.0, the results showed that the average value of the data in this group was 2.963, the test t-value was -0.402, and the p-value was 0.688, indicating that there was no significant difference between the data and the test value (p>0.05).
From the above table, it can be seen that using a single sample t-test, the variable A2 and the test value 3.0 were subjected to a single sample t-test. The results showed that the average value of the data in this group was 2.778, the test t-value was -1.975, and the p-value was 0.052, indicating that there was no significant difference between the data and the test value (p>0.05).
From the above table, it can be seen that using a single sample t-test, the variable A3 and the test value 3.0 were subjected to a single sample t-test. The results showed that the average value of the data in this group was 2.914, the test t-value was -0.926, and the p-value was 0.357, indicating that there was no significant difference between the data and the test value (p>0.05).
From the above table, it can be seen that using a single sample t-test, the variable A4 and the test value 3.0 were subjected to a single sample t-test. The results showed that the average value of the data in this group was 2.778, the test t-value was -2.349, and the p-value was 0.021, indicating a significant difference between the data and the test value (p<0.05).
From the above table, it can be seen that using a single sample t-test, the variable A5 and the test value 3.0 were subjected to a single sample t-test. The results showed that the average value of this group of data was 2.333, the test t-value was -5.595, and the p-value was 0.0, indicating a significant difference between the data and the test value (p<0.05).
The above results show that a single sample t-test was applied in variables A1 to A5 and compared with the test value 3. By comparing the mean, t-value, and p-value of each variable, we can determine whether there is a significant difference between the data and the test value. In this result, variables with larger p-values (greater than 0.05) indicate no significant difference between the data and the test value, while variables with smaller p-values indicate a significant difference between the data and the test value.
Interpretation of Result Parameters:
1.Sample size: Refers to the number of samples for analysis.
2.Minimum value: The minimum value in the dataset.
3.Maximum value: The maximum value in the dataset.
4.Mean: The average of the dataset.
5.Standard deviation: The degree of dispersion in a dataset, used to measure the degree of variability in the data.
6.T-value: A statistical indicator used in a single sample t-test to measure the significant difference between the sample and the test value. The calculation of t-value is based on sample mean, sample standard deviation, and sample size.
7.P-value: A statistical indicator in a single sample t-test that represents the significance of the difference between the sample and the test value. The range of p-values is between 0 and 1, and when it is less than the set significance level (usually set to 0.05), the result is considered significant.
Reference:
[1]张祥云. 在Excel中利用单样本t检验对麦汁理化指标进行评价.《 CNKI 》,2010
[2]付岳林,杨民红,李兰会. 生物统计学单样本t检验的SPSS实现.《 CNKI 》,2018
关注微信公众号发送【示例数据】获取SPSSMAX练习示例数据。
