Ordered Logistic Regression
Ordered Logistic Regression, also known as the Ordered Multinomial Logit Model, is a statistical analysis method used to process ordered categorical variables. It is an extended form of logistic regression, suitable for situations where the dependent variable has multiple ordered categories.
The goal of ordered logistic regression is to establish a model to predict the categories of ordered categorical variables. These categories usually have a certain order relationship, such as "very dissatisfied", "dissatisfied", "generally satisfied", and "very satisfied". Ordered logistic regression uses a potential continuous variable whose value is associated with the threshold between each category. The model determines the range of potential variables by estimating these thresholds, thereby mapping the observed values to the corresponding categories。
The mathematical model of ordered logistic regression is based on a multiple logistic model, which applies a Cumulative Distribution Function (CDF). This function describes the relationship between the probability of each category and potential variables. The commonly used CDF functions include the logit function, probit function, and cloglog function.
For the modeling process of ordered logistic regression, the maximum likelihood estimation method is usually used to estimate the parameters of the model. These parameters can be used to explain the relationship between independent and dependent variables, as well as to predict the categories of new observations.
Ordered logistic regression has applications in multiple fields, such as social sciences, medical research, market research, etc. It can help researchers understand and predict the behavior and influencing factors of ordered categorical variables, thereby providing valuable information for decision-making.
Data description:

Background description:
Ordered logistic regression is a statistical method used to study the relationship between ordered dependent variables and independent variables. It assumes that the dependent variable follows an ordered distribution and uses the maximum likelihood estimation method to fit the model. By calculating the logarithmic probability ratio at different levels of independent variables, this model can help us understand the impact of independent variables on the dependent variable. In this study, we use ordered logical regression to explore the impact of the number of siblings on a dependent variable, and explain and infer through the model results
The analysis results are as follows:
Using ['A1 ',' A2 ',' A3 '] as the independent variable, and the number of brothers and sisters as the dependent variable, we conducted binary Logit regression analysis. From the table above, we can see that a total of 80 samples participated in the analysis.
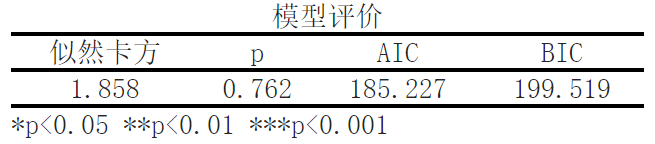
The results of the likelihood ratio chi square test of the model show that the significance P-value is 0.762>0.05, which does not show significance at the level and cannot reject the original hypothesis. Therefore, the model is invalid.
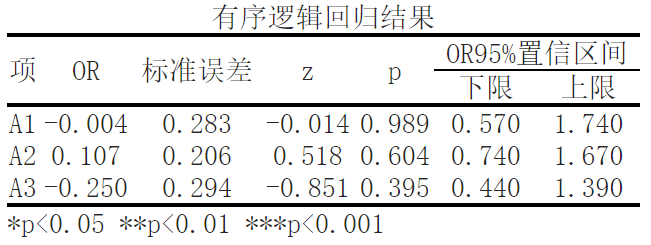
Based on variable A1, the significance P value is 0.989, which does not present significance horizontally, and the original hypothesis cannot be rejected, so A1 will not have a significant impact on the number of brothers and sisters.
Based on variable A2, the significance P value is 0.604, which does not show significance horizontally, and the original hypothesis cannot be rejected, so A2 will not have a significant impact on the number of brothers and sisters.
Based on variable A3, the significance P value is 0.395, which does not show significance horizontally, and the original hypothesis cannot be rejected, so A3 will not have a significant impact on the number of brothers and sisters.
In this study, we used an ordered logistic regression model to study the impact of the number of siblings on a dependent variable. The following is an explanation of the model results:
Background description:
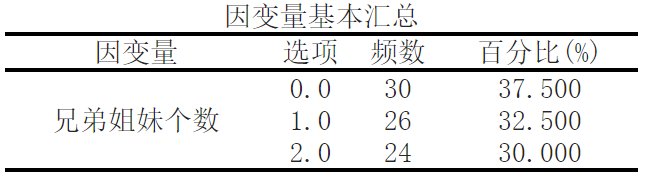
First, let's look at the basic summary information of the number of brothers and sisters. In our sample, 30 people have no brothers and sisters (0.0), 26 people have one brother and sisters (1.0), and 24 people have two brothers and sisters (2.0).
Next, we evaluated the model. The likelihood chi square value is 1.858, corresponding to a p-value of 0.762, indicating that the fitting effect of our model is acceptable. The AIC (Chi Chi Information Criterion) value is 185.227, and the BIC (Bayesian Information Criterion) value is 199.519. These two indicators are used to evaluate the complexity and goodness of fit of the model. The lower the value, the better the model.
Finally, let's take a look at the results of ordered logistic regression. The ordered logistic regression model models the relationship between the independent variable (in this case, the number of brothers and sisters) and the dependent variable as an ordered distribution. For each independent variable, we reported its logarithmic probability ratio (OR) and corresponding statistical indicators.
关注微信公众号发送【示例数据】获取SPSSMAX练习示例数据。
