Paired Sample T test
Matched samples t-test is a population mean difference test based on t-distribution when the observed values originate from paired samples in a paired design.
Data description:
Background description:
Paired t-test is a statistical method used to compare the differences between paired samples. By comparing the mean difference, t-value, and p-value of each pair, we can determine whether there is a significant difference between the paired data. Pairs with lower p-values indicate significant differences, while pairs with higher p-values indicate no significant differences. The effect value can help researchers understand the substantial magnitude of differences. Paired t-tests can help researchers evaluate the differences between two related variables or participants, and provide statistical basis to support or refute research hypotheses. These analysis results are crucial for conducting empirical research and evaluating the relationship between variables The variable of 05) indicates no significant difference between the data and the test value, while the variable with a smaller p-value (less than 0.05) indicates a significant difference between the data and the test value. These analysis results can help researchers evaluate whether the data meets their expected assumptions and provide statistical basis to support or refute these assumptions.
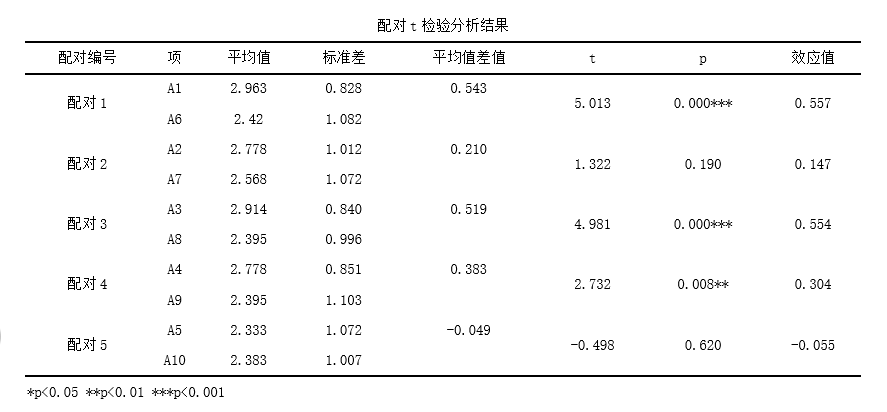
From the above table, it can be seen that paired sample t-tests were conducted on variables A1 and A6, and the results showed that the average value of A1 was 2.963, with a standard deviation of 0.828; The average value of A6 is 2.42, with a standard deviation of 1.082; The average difference between the two sets of data is 0.543; The t-value is 5.013 and the p-value is 0.0. There is a significant difference (p<0.05) between the two sets of data.
From the above table, it can be seen that paired sample t-tests were conducted on variables A2 and A7, and the results showed that the average value of A2 was 2.778, with a standard deviation of 1.012; The average value of A7 is 2.568, with a standard deviation of 1.072; The average difference between the two sets of data is 0.21; The t-value is 1.322 and the p-value is 0.19. There was no significant difference between the two sets of data (p>0.05).
From the above table, it can be seen that paired sample t-tests were conducted on variables A3 and A8, and the results showed that the average value of A3 was 2.914, with a standard deviation of 0.84; The average value of A8 is 2.395, with a standard deviation of 0.996; The average difference between the two sets of data is 0.519; The t-value is 4.981, and the p-value is 0.0. There is a significant difference (p<0.05) between the two sets of data.
From the above table, it can be seen that paired sample t-tests were conducted on variables A4 and A9, and the results showed that the average value of A4 was 2.778, with a standard deviation of 0.851; The average value of A9 is 2.395, with a standard deviation of 1.103; The average difference between the two sets of data is 0.383; The t-value is 2.732, and the p-value is 0.008. There is a significant difference (p<0.05) between the two sets of data.
From the above table, it can be seen that paired sample t-tests were conducted on variable A5 and variable A10, and the results showed that the average value of A5 was 2.333, with a standard deviation of 1.072; The average value of A10 is 2.383, with a standard deviation of 1.007; The average difference between the two sets of data is -0.049; The t-value is -0.498, and the p-value is 0.62. There was no significant difference between the two sets of data (p>0.05).
Interpretation of Result Parameters:
1.Pairing ID: Used to identify the sample pair being paired.
2.Item: Refers to each item or variable in a pair.
3.Mean: The average value of each item in the pairing.
4.Standard deviation: The standard deviation of each item in the pairing, used to measure the degree of variation in the data.
5.Mean difference: The difference between the average values of each item in the pairing.
6.T-value: A statistical indicator used in paired t-tests to measure significant differences between paired data. The calculation of t-value is based on the difference in mean and standard deviation of paired samples, as well as the number of paired samples.
7.P-value: A statistical indicator used in paired t-tests to represent the significance of differences between paired data. The range of p-values is between 0 and 1, and when it is less than the set significance level (usually set to 0.05), the result is considered significant.
8.Effect size: The size of the paired t-test, used to measure the degree of difference between paired data.
Reference:
[1]赵正松,潘登登.基于两独立样本和配对样本T检验分析出租车行业运行规律.《 CNKI 》,2013
[2]査如琴. 基于SPSS的双总体(σ_1~2,σ_2~2未知,n≤30)配对样本t检验与独立样本t检验.《 读与写(教育教学刊) 》,2016
[3]2014年我国两次降准对利率风险溢价的影响——基于两配对样本t检验的实证分析.《 CNKI 》,2016
关注微信公众号发送【示例数据】获取SPSSMAX练习示例数据。
