Paired Sample Wilcoxon
The Wilcoxon signed rank test, also known as the Wilcoxon rank test of symbols, adds the rank of the absolute value of the difference between the observed value and the center position of the null hypothesis according to different symbols as its test statistic. It is suitable for paired comparisons in T-tests, but it does not require the difference between paired data to follow a normal distribution, only a symmetric distribution is required. Verify whether the difference in paired observation data comes from a population with a mean of 0 (whether the population generating the data has the same mean).
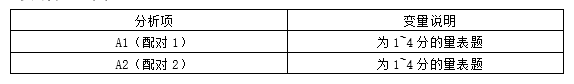
Data description:
The results show:
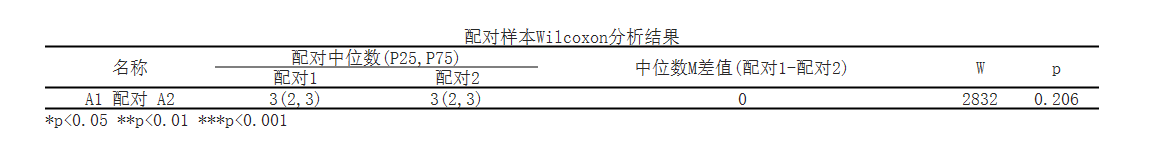
The Wilcoxon signed rank sum test was performed on variables A1 and A2, and the results showed that the median of A1 was 3.0, the 25th percentile was 3.0, and the 75th percentile was 3.0; The median of A2 is 3.0, the 25th percentile is 2.0, and the 75th percentile is 3.0; The median difference between the two sets of data is 0.0; The p-value is 0.206>0.05, indicating that there is no significant difference between the two groups of data.
Detailed explanation of indicators: 1.Paired median (P25, P75): This is the median of paired sample A1 and paired sample A2 on the corresponding indicators. The median is the value in the middle position after arranging the data in order of size. P25 represents the 25th percentile, P75 represents the 75th percentile, and they represent the distribution range of the data. 2.Median M difference (paired 1- paired 2): This is the difference in the median between paired samples A1 and A2, used to measure the difference between two paired samples. If the difference is positive, it means that the median of paired sample A1 is higher than that of paired sample A2, and vice versa. 3.W: W is the statistical value of the Wilcoxon rank sum test used to evaluate differences between paired samples. A larger W value indicates a significant difference. 4.p: The p-value is the significance level of the Wilcoxon rank sum test, used to determine whether the differences between paired samples are statistically significant. If the p-value is less than the pre-set significance level (usually 0.05), it can be considered that there is a significant difference between paired samples.Reference:
[1]吴喜之 赵博娟.非参数统计:中国统计出版社,2011年
[2]秦山, 汪晓银. 秩和检验在饲料科学研究中的应用[J]. 饲料广角, 2003(21):30-32.
[3]《数学辞海》委员会. 数学辞海(1-6).第6卷[M]. 山西教育出版社, 2002.
关注微信公众号发送【示例数据】获取SPSSMAX练习示例数据。
