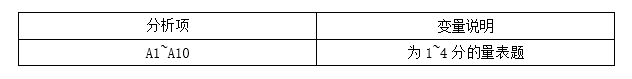
Pearson Correlation
The Pearson correlation coefficient is used to measure the correlation (linear correlation) between two variables X and Y, with a value between -1 and 1. The value of the coefficient of 1 means that X and Y can be well described by the linear equation, and all data points fall well on a straight line, and Y increases with the increase of X.
Background description:
The provided data is the Pearson correlation coefficient analysis results between a set of variables. Pearson correlation coefficient is a statistical indicator used to measure the linear relationship between two variables, with values ranging from -1 to 1.
The positive and negative correlation coefficients indicate a positive or negative correlation between variables, while the magnitude of absolute values indicates the strength of the correlation.
In the analysis results, the asterisk after the correlation coefficient represents the significance level of the correlation, i.e. * p<0.05 indicates that the correlation is significant at a significance level of 0.05, * * p<0.01 indicates that the correlation is significant at a significance level of 0.01, and * * * p<0.001 indicates that the correlation is significant at a significance level of 0.001.
The analysis results are as follows:
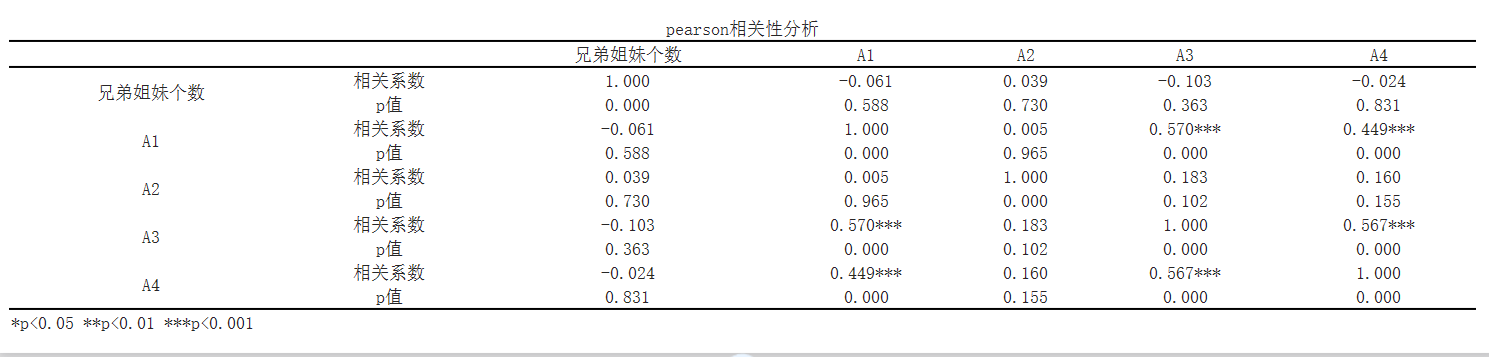
According to Pearson correlation analysis,
The correlation analysis between A1 and A2 was not significant and there was no significant correlation (r=0.005, p=0.965>0.05). The correlation analysis between A1 and A3 showed a significant positive correlation (r=0.570, p=0.000<0.05). The correlation analysis between A1 and A4 showed a significant positive correlation (r=0.449, p=0.000<0.05). The correlation analysis between A2 and A3 was not significant and there was no significant correlation (r=0.183, p=0.102>0.05). The correlation analysis between A2 and A4 was not significant and there was no significant correlation (r=0.160, p=0.155>0.05). The correlation analysis between A3 and A4 showed a significant positive correlation (r=0.567, p=0.000<0.05). There was no significant correlation between the number of siblings and A1 (r=-0.061, p=0.588>0.05). There was no significant correlation between the number of brothers and sisters and A2 (r=0.039, p=0.730>0.05). There was no significant correlation between the number of sisters and A3 (r=-0.103, p=0.363>0.05). There was no significant correlation between the number of sisters and A4 (r=-0.024, p=0.831>0.05).
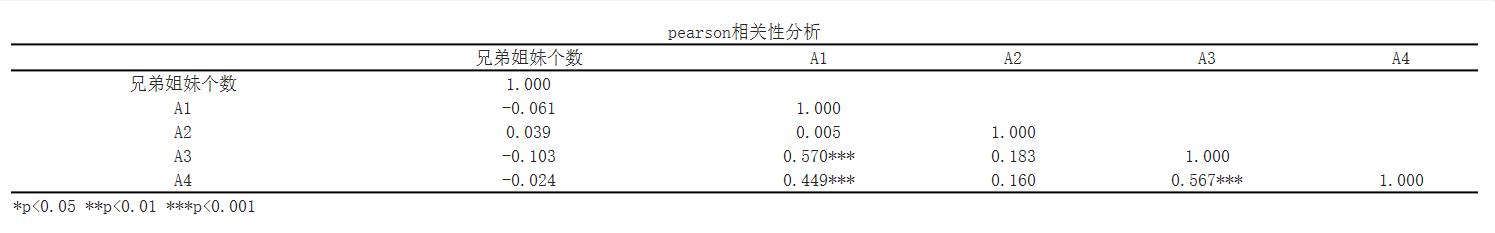
At the same time, SPSSMAX also provides another format of correlation analysis table.
Thermal map output for correlation analysis:
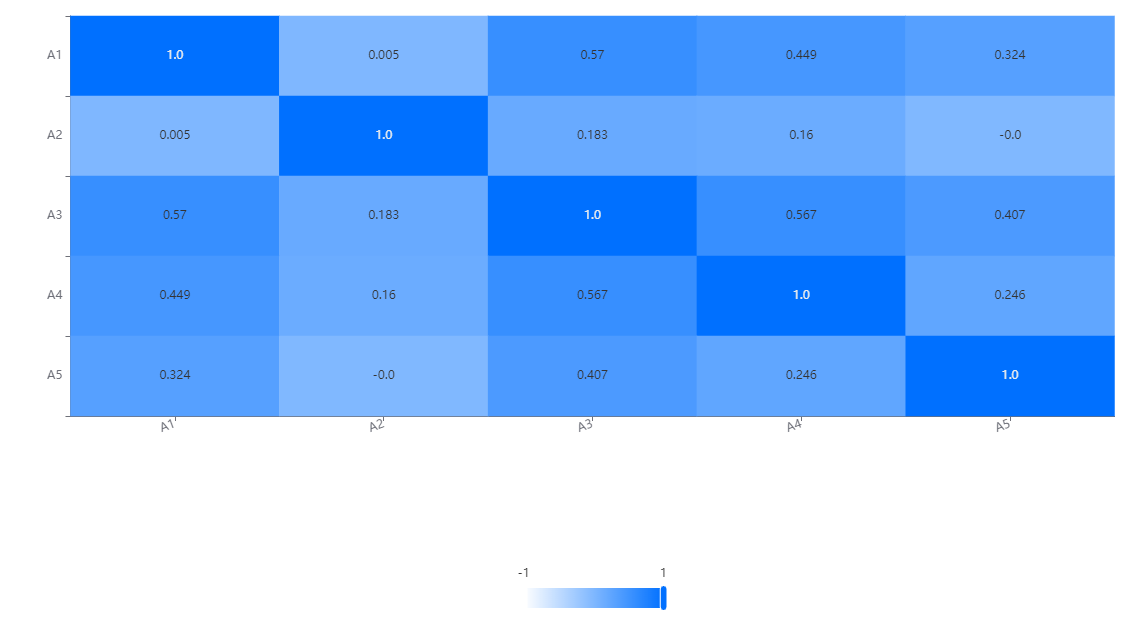
In the correlation heat map, each variable is represented as a row and column in the chart. Through the cells on the diagonal, we can see the correlation between each variable and itself, which is always 1 because a variable is completely related to itself.
The cells on non diagonal lines reflect the correlation between different variables. The depth of the color indicates the strength of the correlation, usually represented by a color gradient. Usually, darker colors (such as dark blue) indicate a strong positive correlation, while lighter colors (such as light blue) indicate a strong negative correlation. The middle color (such as white or light yellow) indicates weak or close to zero correlation.
Reference:
[1]王涓,吴旭鸣,王爱凤. 应用皮尔逊相关系数算法查找异常电能表用户. 《 CNKI;WanFang 》 , 2014
[2]李宏彬,赫光中,果秋婷. 基于皮尔逊相关系数的有机质谱相似性检索方法. 《 化学分析计量 》 , 2015
[3]姚豪立,王培慧,汝黎明. 基于皮尔逊相关系数算法的台区相位识别方法. 2018
[4]杨帆,冯翔,阮羚,陈俊武等. 基于皮尔逊相关系数法的水树枝与超低频介损的相关性研究. 《 高压电器 》 , 2014
关注微信公众号发送【示例数据】获取SPSSMAX练习示例数据。
