Poisson Distribution
The Poisson distribution is a discrete probability distribution in statistics used to describe the number of times an event occurs within a fixed time or spatial interval. It assumes that the average rate of event occurrence remains unchanged and that events occur independently.
Data description:

Background note: The Poisson distribution is a probability distribution used to describe the number of times an event occurs within a specific time period or spatial unit. Here, we use the Poisson distribution to test whether there is a significant difference between the actual frequency and the expected frequency. In this Poisson test table, we conducted Poisson distribution tests on two options named A1 and A2.
The analysis results are as follows:
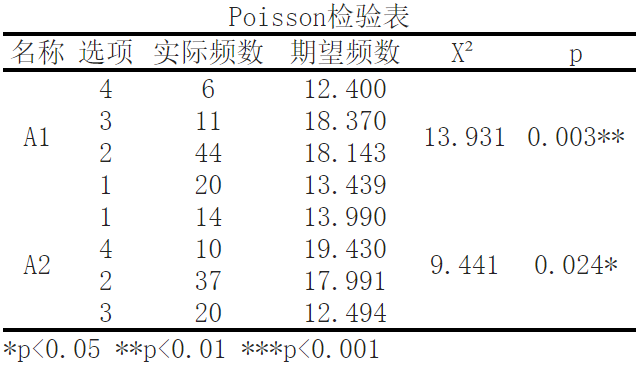
The results of the Poisson test show that based on variable A1, the significance P-value is 0.003<0.05, showing significance at the horizontal level. Therefore, the original hypothesis is rejected, and the data does not follow the Poisson distribution.
The results of the Poisson test show that based on variable A2, the significance P-value is 0.024<0.05, showing significance at the horizontal level. Therefore, the original hypothesis is rejected, and the data does not follow the Poisson distribution.
Firstly, let's take a look at the results of option A1. According to the actual frequency of observations, 4 observations appeared 6 times, 11 observations appeared 18 times, 44 observations appeared 20 times, and 20 observations appeared 13 times. By calculation, the expected frequency of each observation value was obtained, and X ² Statistics are used to evaluate the degree of difference between the actual observation frequency and the expected frequency. In this case, the calculated X ² It is 13.931, and the corresponding p-value is 0.003 * *. This means that if we assume that the actual observed data conforms to the Poisson distribution, then the difference between the observed data and the expected data is highly significant.
Next, let's take a look at the results of option A2. According to the actual frequency of observations, 1 observation value appeared 14 times, 10 observations appeared 19 times, 37 observations appeared 17 times, and 20 observations appeared 12 times. Calculated X ² It is 9.441, corresponding to a p-value of 0.024 *. Similar to the A1 option, this indicates a significant difference between the actual observed data and the expected data.
In summary, the Poisson distribution test is used to evaluate the degree of fit between observed data and the Poisson distribution. It calculates X by ² Statistics and corresponding p-values are used to determine whether there is a significant difference between the actual observed data and the expected data. In this test table, we found that there is a significant difference between the actual observation data of option A1 and option A2 and the Poisson distribution.
Reference:
[1]Law, A. M., & Kelton, W. D. (2015). Simulation modeling and analysis. McGraw-Hill Education.
[2]Ross, S. M. (2019). A first course in probability. Pearson Education.
[3]Walpole, R. E., Myers, R. H., Myers, S. L., & Ye, K. (2011). Probability & statistics for engineers & scientists. Pearson Education.
[4]Mood, A. M., Graybill, F. A., & Boes, D. C. (2015). Introduction to the theory of statistics. McGraw-Hill Education.
[5]Gujarati, D. N., & Porter, D. C. (2009). Basic econometrics (5th ed.). McGraw-Hill International.
关注微信公众号发送【示例数据】获取SPSSMAX练习示例数据。
