Project Analysis
Project analysis is a statistical method used to evaluate the differentiation of various questions or questions in a questionnaire or survey data. It is mainly used to determine whether a question or question can effectively distinguish the different characteristics or attitudes of the respondents. Here, 27% and 73% high and low grouping are used for differentiation analysis, which is mainly used to determine the degree of difference between these two groups to determine whether there is a significant differentiation.
Data description:

Background description:
Project analysis is a statistical analysis method used to evaluate and compare differences between different groups (or conditions). Through project analysis, we can determine which indicators have significant differences between high and low groups, thereby guiding the decision on whether the item needs to be eliminated. In this case, by comparing the average values and statistical indicators of the low and high groups, we concluded that on the three indicators A1, A2, and A3, the high group performed significantly better than the low group, so all three items did not need to be removed, indicating good discrimination.
The analysis results are as follows:
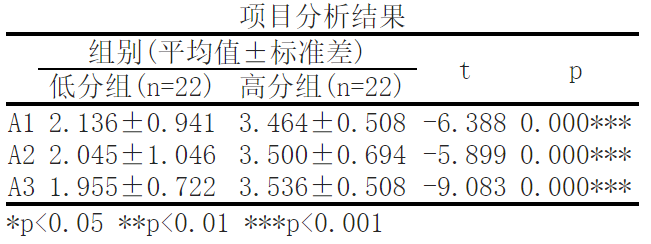
The results showed that there was a significant difference in variable A1 between the low and high groups, with a t-value of -6.39 and a p-value of 0.00<0.05. This indicates that there is a significant difference in the item between the high and low groups, and the item can be retained.
The results showed that there was a significant difference in variable A2 between the low and high groups, with a t-value of -5.90 and a p-value of 0.00<0.05. This indicates that there is a significant difference in the item between the high and low groups, and the item can be retained.
The results showed that there was a significant difference in variable A3 between the low and high groups, with a t-value of -9.08 and a p-value of 0.00<0.05. This indicates that there is a significant difference in the item between the high and low groups, and the item can be retained.
In this project, project analysis was conducted for two groups (low group and high group). According to the project analysis, the results are as follows:
A1 indicator:In the low group, the average score is 2.136, and the standard deviation is 0.941. In the high scoring group, the average score is 3.464, with a standard deviation of 0.508. The results of t-test showed that there was a significant difference in the A1 index between the low and high groups, with a t-value of -6.388, p<0.05 * *. This means that on the A1 indicator, the average score of the high group is significantly better than that of the low group. Therefore, it is recommended to retain the A1 indicator. A2 indicator:In the low group, the average score is 2.045, and the standard deviation is 1.046. In the high scoring group, the average score is 3.500, with a standard deviation of 0.694. According to the t-test results, there is a significant difference in the A2 index between the low and high groups, with a t-value of -5.899, p<0.05 * *. This indicates that on the A2 indicator, the average score of the high group is significantly better than that of the low group. It is recommended to retain the A2 indicator. A3 indicator:In the low group, the average score is 1.955, and the standard deviation is 0.722. In the high scoring group, the average score is 3.536, with a standard deviation of 0.508. According to the t-test results, there is a significant difference between the low and high groups in the A3 index, with a t-value of -9.083, p<0.05 * *. This indicates that on the A3 indicator, the average score of the high group is significantly better than that of the low group. Therefore, it is recommended to retain the A3 indicator.
关注微信公众号发送【示例数据】获取SPSSMAX练习示例数据。
