Ridge Regression
Ridge Regression is a regularization method used for linear regression analysis. It can reduce the variance of the model and prevent overfitting in high-dimensional data by constraining the coefficients of the model. The essence of ridge regression is to add a regularization term to the loss function, penalize the model parameters, and obtain a new loss function that can be optimized using methods such as gradient descent.
Data description:
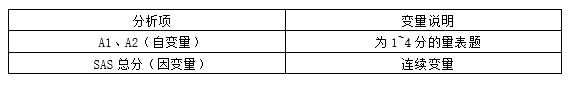
Background description:
Ridge regression analysis is mainly applied in cases where there is collinearity or a small sample size in linear regression models. When there is a high correlation between independent variables or the sample size is insufficient to support the assumption of the ordinary least squares method, ridge regression can solve these problems by introducing ridge penalty terms. This analysis provides an assessment of the impact of each indicator variable on the dependent variable and helps us understand the contribution of each indicator variable.
It uses a ridge penalty term on the basis of the ordinary least squares method to reduce the variance of the model. It balances goodness of fit and model complexity by introducing a ridge penalty term. Ridge regression can improve the performance of models in the presence of collinearity or when the sample size is smaller than the number of variables.
In this analysis, we use ridge regression analysis to investigate the impact of various indicator variables (including constant terms) on the dependent variable (SAS total score). The non standardized coefficient represents the average impact of the indicator variable on the dependent variable. By using the 95% Bootstrap confidence interval, we can determine the range of regression coefficients. The t-value and corresponding p-value are used to test whether the regression coefficient is significant.
The analysis results are as follows:
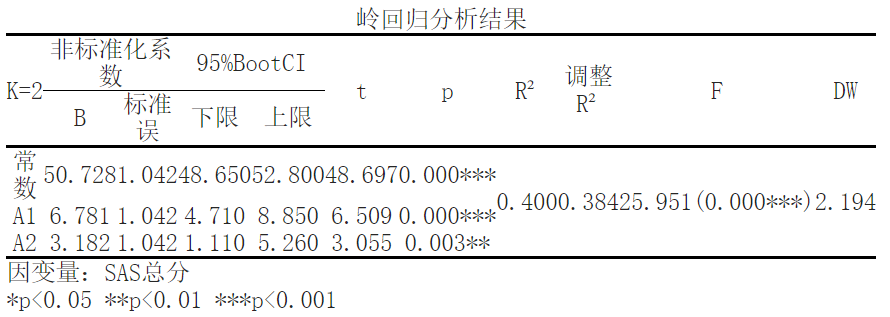
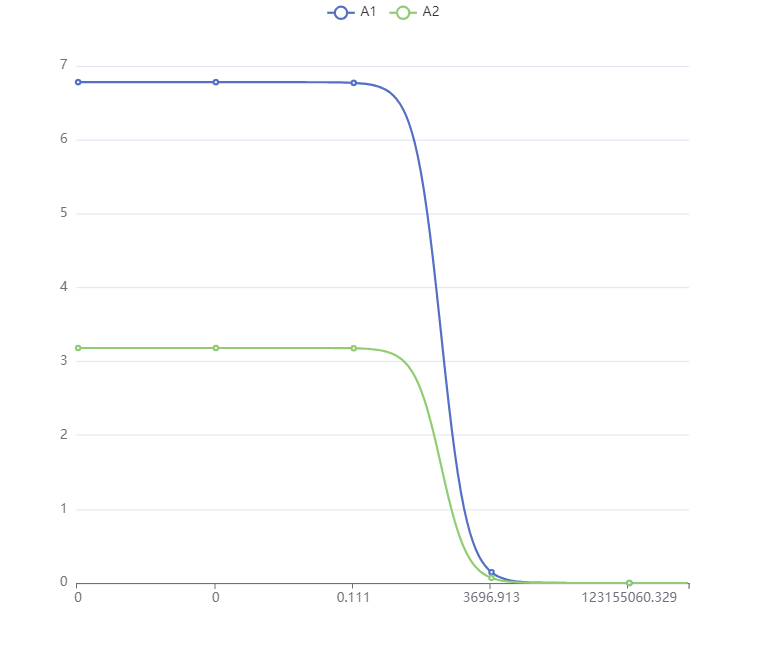
The results showed that using ['SAS total score '] as the dependent variable and ['A1','A2 '] as the independent variables for ridge regression analysis, it can be seen from the above table that when the k-value is 2; The R-squared value of the model is 0.4, which means that ['A1 ',' A2 '] can explain the 39.954663% change in ['SAS total score']. The results show that when the K value is greater than or equal to 2, the standardized regression coefficient tends to stabilize. Meanwhile, the goodness of fit R of the model ² It is 0.399, and the model performs well. At this point, the significance P-value of the F-test is 0.0<0.05, showing significance at the level, rejecting the original hypothesis, indicating a regression relationship between the independent variable and the dependent variable.
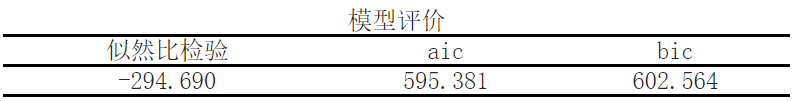
In the analysis results, model evaluation was first conducted. Likelihood ratio test, AIC (Akaike information criterion), and BIC (Bayesian information criterion) are statistical indicators used to evaluate the goodness of fit and generalization ability of a model.
- The Likelihood Ratio Test is used to compare the goodness of fit of two or more models, with a value of -294.690.
- AIC and BIC are the criteria for model selection, taking into account the fitting effect and model complexity. The value of AIC is 595.381, and the value of BIC is 602.564. A smaller value indicates a better model.
The following section presents the results of ridge regression analysis. Ridge regression is a regression analysis method used to handle multicollinearity, which controls the complexity of the model by introducing regularization terms (ridge terms), thereby improving the stability and generalization ability of the model.
The specific analysis results are as follows:
- K=2: Here, K represents the number of independent variables in the model, which means that the ridge regression model considers two independent variables.
- Non standardized coefficients: provide regression coefficients for the independent variable, which represent the degree of influence of the independent variable on the dependent variable. For example, the regression coefficient of variable A1 is 6.781, and the regression coefficient of variable A2 is 3.182.
- 95%BootCI: provides the confidence interval of the regression coefficients for estimating the accuracy of the coefficients. The upper and lower limits respectively represent the boundaries of the confidence interval.
- The t and p: t statistics are used to test whether the regression coefficient is significantly non zero, and the p-value represents the level of significance of the coefficient. For example, the t-statistic of the constant term is 25.951, corresponding to a p-value of 0.000 * * * (significance level is very low).
- R ² And adjust R ²: R ² Represent the goodness of fit of the model to the observed values, adjust R ² The influence of the number of independent variables and sample size was considered for comparison and selection of models. Here, R ² 0.400, adjust R ² It is 0.384, and a higher value indicates that the model fits better.
- F-statistic: F-statistic is used to test the significance of the overall goodness of fit of the model. Here, the F-statistic is 48.697, corresponding to a p-value of 0.000 * *..
- DW statistic: The Durbin Watson statistic is used to test whether there is autocorrelation (correlation between error terms) in the model. A value close to 2 indicates no autocorrelation, where the DW statistic is 2.194.
Finally, the definition of the dependent variable as "SAS total score" was given“*p<0.05 **p<0.01 ***p<0.001"Indicates the level of statistical significance.
In summary, ridge regression analysis deals with multicollinearity problems by introducing regularization terms, and obtains a set of regression coefficients for independent variables and dependent variables. The results indicate that the model has good goodness of fit and predictive ability at a lower significance level when considering two independent variables.
Reference:
[1]Tikhonov, A. N. (1943). "On the stability of inverse problems". Dokl. Akad. Nauk. USSR.7: 386–389.
[2]Hoerl, A.E.; Kennard, R.W. (1970). "Ridge Regression: Biased Estimation for Nonorthogonal Problems". Technometrics.12 (1): 55–67.
关注微信公众号发送【示例数据】获取SPSSMAX练习示例数据。
