Roc Curve
The Receiver Operating Characteristic Curve is a graphical tool used to evaluate the performance of binary classification models. It displays the performance of classification models at different thresholds by plotting the relationship between sensitivity (true positive rate) and specificity (false positive rate). The area of the ROC curve (AUC) is often used to measure the performance of classifiers, and the closer the AUC value is to 1, the better the performance of the classifier.
Background description:
ROC curve testing is commonly used to evaluate the performance of classification models, especially in fields such as medical diagnosis, machine learning, and data mining. It can help us choose the optimal classification threshold and evaluate the accuracy of the model through the AUC value. ROC curve testing is commonly used to evaluate the performance of classification models, especially in fields such as medical diagnosis, machine learning, and data mining. It can help us choose the optimal classification threshold and evaluate the accuracy of the model through the AUC value.
The analysis results are as follows:
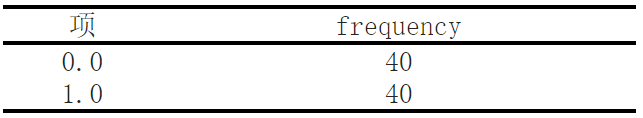
The first category has a group of 40 people.
The second group consists of 40 people. (This is the value of the state variable)
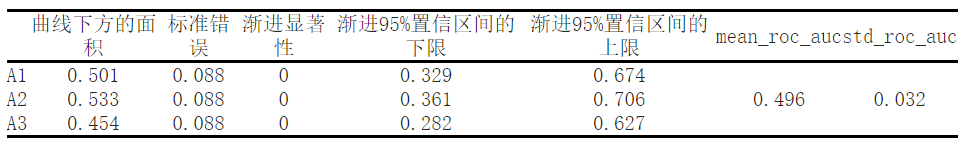
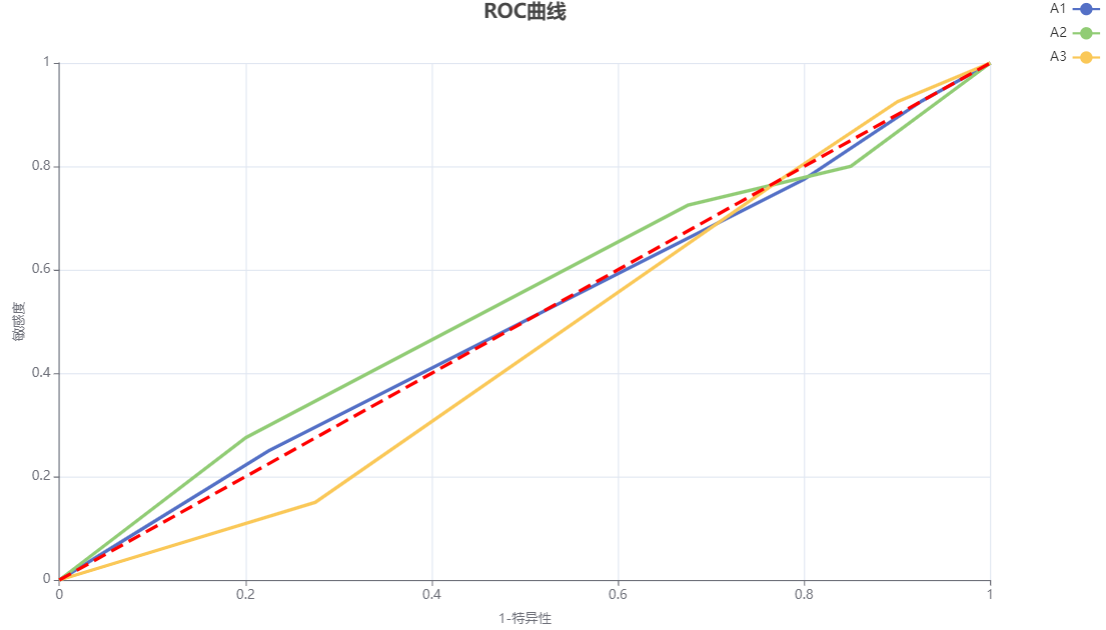
In A1, 0.5<AUC<0.7: This indicates that the predictive diagnostic value of this variable is very low, which is relatively common.
In A2, 0.5<AUC<0.7: This indicates that the predictive diagnostic value of this variable is very low, which is relatively common.
In A3, AUC<0.5: This indicates that the variable does not match the actual situation, and the predictive diagnosis is worse than random guessing. It should not appear in the actual situation.
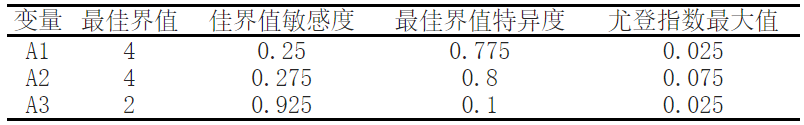
The ROC analysis results show that when the optimal threshold for A1 is 4, the sensitivity of the optimal threshold for A1 is 0.25, the specificity of the optimal threshold is 0.775, and the maximum value of the Uden index is 0.025.
The ROC analysis results show that when the optimal threshold for A2 is 4, the sensitivity of the optimal threshold for A2 is 0.275, the specificity of the optimal threshold is 0.8, and the maximum value of the Uden index is 0.075.
The ROC analysis results show that when the optimal threshold for A3 is 2, the sensitivity of the optimal threshold for A3 is 0.925, the specificity of the optimal threshold is 0.1, and the maximum value of the Uden index is 0.025.
The results show that the average AUC under the total variable is 0.496. AUC<0.5: This indicates that the included variables do not match the actual situation, and the predictive diagnosis is worse than random guessing, which should not occur in the actual situation.
The results show that the average AUC under the total variable is 0.496. AUC<0.5: This indicates that the included variables do not match the actual situation, and the predictive diagnosis is worse than random guessing, which should not occur in the actual situation.
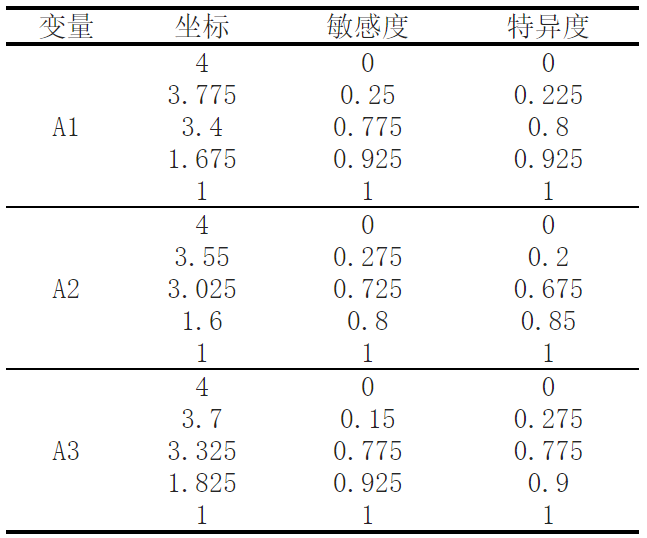
Firstly, let's explain the meaning of each indicator. In the frequency table, we list the different values and frequencies of each variable. Then, in the table of coordinates, sensitivity, and specificity, we listed the sensitivity and specificity of each variable at different boundary values.
Next, in the area table below the curve, we calculated the area under the curve (AUC) for each variable's ROC curve. The value of AUC is between 0 and 1, and the closer the value is to 1, the better the performance of the model. We also provided Standard Error and Asymptotic Significance, as well as the lower and upper limits of the asymptotic 95% confidence interval.
Finally, in the optimal threshold table, we provide the optimal threshold, sensitivity, and specificity for each variable, as well as the maximum value of the Youden Index. The maximum value of the Youden index is the boundary value that reaches its maximum value when the sum of sensitivity and specificity is subtracted by 1.
Reference:
[1] HANLEY J A, OTHERS. Receiver operating characteristic (ROC) methodology: The state of the art[J]. Crit Rev Diagn Imaging, 1989, 29(3): 307-335.
[2]王敬瀚.ROC曲线在临床医学诊断实验中的应用[J].中华高血压杂志,2008,16(2):175-177
[3]邹莉玲,余小金,闵捷,沈其君.ROC曲线在医学诊断中的应用与进展[J].东南大学学报:医学版,2003,22(1):67-70
[4]宋花玲,贺佳,黄品贤,李素云.ROC曲线下面积估计的参数法与非参数法的应用研究[J].第二军医大学学报,2006,27(7):726-728
[5]邹莉玲,沈其君,陈峰,郑凯尔.ROC曲线下面积的ML估计与假设检验[J].中国公共卫生,2003,19(1):127-128.
关注微信公众号发送【示例数据】获取SPSSMAX练习示例数据。
