Single Factor Analysis Of Variance And Tukey Post Test
Tukey's post hoc test, also known as Tukey's HSD (Honestly Significant Difference) test, is a widely used multiple comparison method. It is mainly used to determine whether there are significant differences between two or more groups. When the analysis of variance (ANOVA) method shows significant differences between at least one group, Tukey post test can help determine which groups have significant differences.
The results of post test analysis of variance can only detect three or more population means that are identical or not identical. When they are not exactly the same, it is not known which population mean or which population mean differs from other population means. Therefore, after the analysis of variance is completed, it is necessary to conduct multiple tests after work to determine which or which population means are different.
Data description:
Background description:
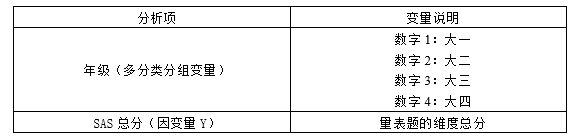
This analysis of variance is conducted on the performance of students of different grades in multiple projects. We have four grades (1, 2, 3, and 4) and have evaluated the total SAS score among them.
The purpose of variance analysis is to determine whether there are significant differences between different groups and further understand the degree of differences between different groups in each project. By comparing the mean, standard deviation, F-value, and p-value, we can determine the impact of groups on different projects and the comparison results between them.
In addition, we also conducted multiple post hoc comparisons of tukey to delve deeper into the average differences between different groups. By comparing the average difference, p-value, and confidence interval between different groups, we can further understand the specific differences between different groups in various projects.
The analysis results are as follows:

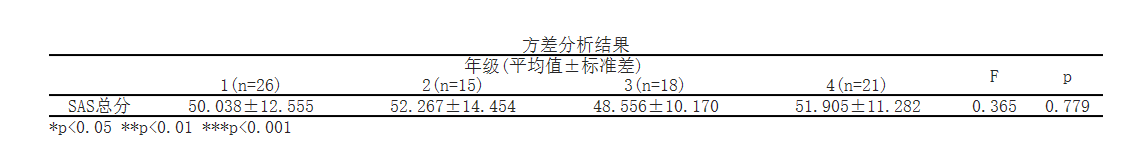
From the above table, it can be seen that conducting one-way analysis of variance (also known as one-way analysis of variance) on the total SAS score showed a total average of 50.612, a total standard deviation of 11.976, an F-value of 0.365, and a p-value of 0.779, indicating that there was no significant difference in the total SAS scores among different groups (p>0.05).
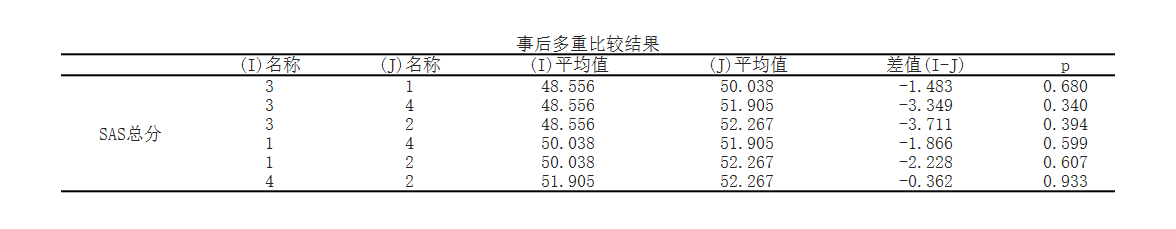
From the comparison afterwards, it can be seen that,
The results showed that within the variable SAS total score, there was no significant difference between item 3 and item 1, which had a mean difference of -1.483 and a p-value of 0.680>0.05.
The results showed that within the variable SAS total score, there was no significant difference between items 3 and 4, which had a mean difference of -3.349 and a p-value of 0.340>0.05.
The results showed that within the variable SAS total score, there was no significant difference between item 3 and item 2, which had a mean difference of -3.711 and a p-value of 0.394>0.05.
The results showed that within the variable SAS total score, there was no significant difference between items 1 and 4, which had a mean difference of -1.866 and a p-value of 0.599>0.05.
The results showed that within the variable SAS total score, there was no significant difference between items 1 and 2, which had a mean difference of -2.228 and a p-value of 0.607>0.05.
The results showed that there was no significant difference between item 4 and item 2 in the variable SAS total score, with a mean difference of -0.362 and a p-value of 0.933>0.05.
Reference:
[1]Armstrong R A. When to use the Bonferroni correction[J]. Ophthalmic & Physiological Optics the Journal of the British College of Ophthalmic Opticians, 2015, 34(5):502-508.
[2]张厚粲, 徐建平. 现代心理与教育统计学.第3版[M]. 北京师范大学出版社, 2009.
[3] 刘鹏. 大学生手机依赖与社会支持及人格特质的关系研究[D]. 华中师范大学.
关注微信公众号发送【示例数据】获取SPSSMAX练习示例数据。
