Spearman Related
The Spearman correlation coefficient is a non parametric indicator that measures the dependence of two variables and is defined as the Pearson correlation coefficient between hierarchical variables. It uses a monotonic equation to evaluate the correlation between two statistical variables. If there are no duplicate values in the data, and when two variables are completely monotonically correlated, the Spearman correlation coefficient is+1 or − 1.
Background description:
The provided data is the Spearman correlation coefficient analysis results between a set of variables. Spearman correlation coefficient is a statistical indicator used to measure the correlation between two hierarchical variables, with values ranging from -1 to 1- 1 to 1.
The positive and negative correlation coefficients indicate a positive or negative correlation between variables, while the magnitude of absolute values indicates the strength of the correlation.
In the analysis results, the asterisk after the correlation coefficient represents the significance level of the correlation, i.e. * p<0.05 indicates that the correlation is significant at a significance level of 0.05, * * p<0.01 indicates that the correlation is significant at a significance level of 0.01, and * * * p<0.001 indicates that the correlation is significant at a significance level of 0.001.
The analysis results are as follows:
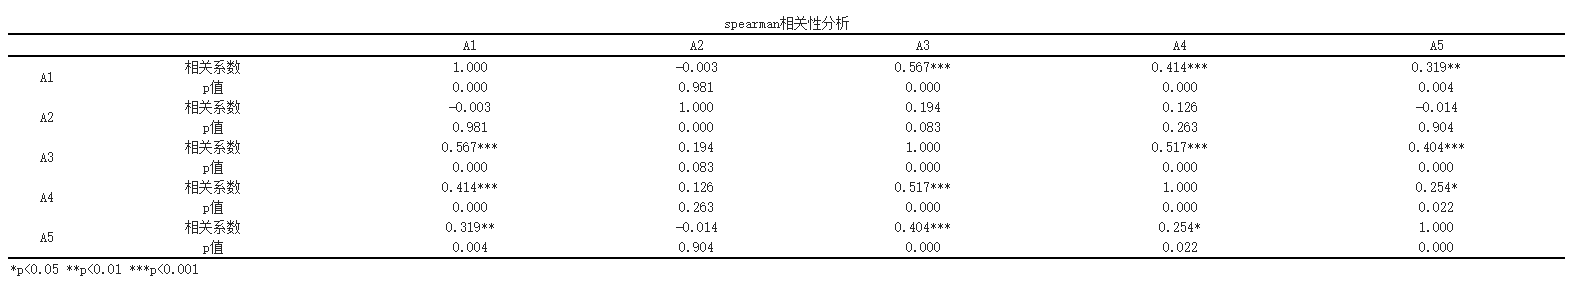
According to Spearman correlation analysis,
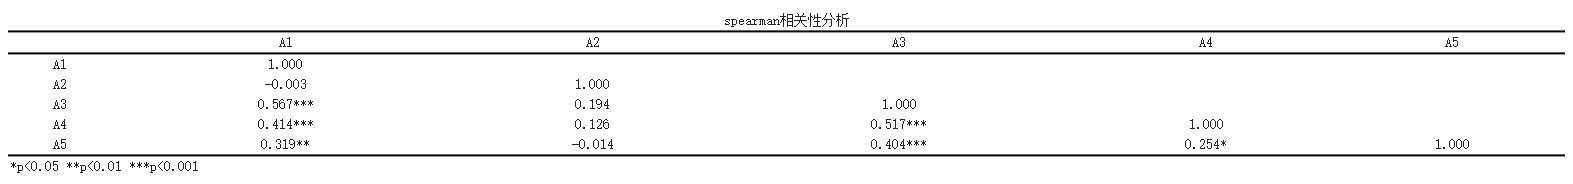
The correlation analysis between A1 and A2 was not significant and there was no significant correlation (r=-0.003, p=0.981>0.05). The correlation analysis between A1 and A3 showed a significant positive correlation (r=0.567, p=0.000 <0.05). The correlation analysis between A1 and A4 showed a significant positive correlation (r=0.414, p=0.000<0.05). The correlation analysis between A1 and A5 showed a significant positive correlation (r=0.319, p=0.004<0.05). The correlation analysis between A2 and A3 was not significant and there was no significant correlation (r=0.194, p=0.083>0.05). The correlation analysis between A2 and A4 was not significant and there was no significant correlation (r=0.126, p=0.263>0.05). The correlation analysis between A2 and A5 was not significant and there was no significant correlation (r=-0.014, p=0.904>0.05). The correlation analysis between A3 and A4 showed a significant positive correlation (r=0.517, p=0.000<0.05). The correlation analysis between A3 and A5 showed a significant positive correlation (r=0.404, p=0.000<0.05). The correlation analysis between A4 and A5 showed a significant positive correlation (r=0.254, p=0.022<0.05). At the same time, SPSSMAX also provides another format of correlation analysis table.
Thermal map output for correlation analysis:
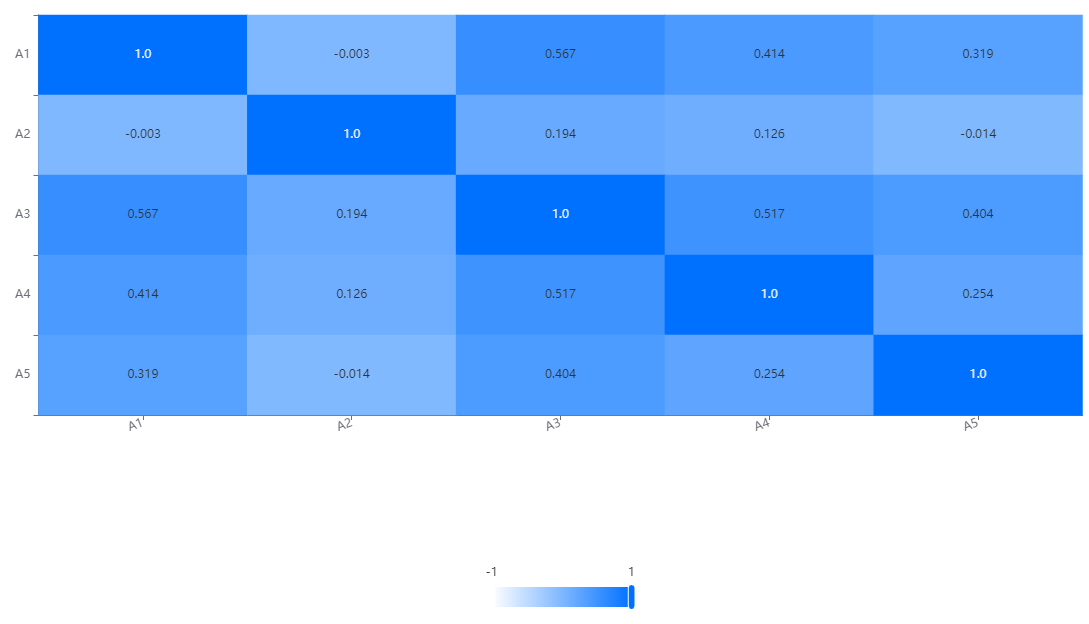
In the correlation heat map, each variable is represented as a row and column in the chart. Through the cells on the diagonal, we can see the correlation between each variable and itself, which is always 1 because a variable is completely related to itself.
The cells on non diagonal lines reflect the correlation between different variables. The depth of the color indicates the strength of the correlation, usually represented by a color gradient. Usually, darker colors (such as dark blue) indicate a strong positive correlation, while lighter colors (such as light blue) indicate a strong negative correlation. The middle color (such as white or light yellow) indicates weak or close to zero correlation.
Reference:
[1] Fieller, E.C.; Hartley, H.O.; Pearson, E.S. (1957) Tests for rank correlation coefficients. I. Biometrika 44, pp. 470–481
[2]Piantadosi, J.; Howlett, P.; Boland, J. (2007) 'Matching the grade correlation coefficient using a copula with maximum disorder', Journal of Industrial and Management Optimization, 3 (2), 305–312
[3]Maritz. J.S. (1981) Distribution-Free Statistical Methods, Chapman & Hall. ISBN 0-412-15940-6. (page 217)
[4]Myers, Jerome L.; Well, Arnold D., Research Design and Statistical Analysis 2nd, Lawrence Erlbaum: 508, 2003, ISBN 0-8058-4037-0
关注微信公众号发送【示例数据】获取SPSSMAX练习示例数据。
