Stepwise Regression
A commonly used method for selecting multiple linear regression models and screening variables. The purpose of this method is to find the optimal regression model by gradually adding or removing independent variables, so that the resulting model has good predictive and explanatory abilities. In practical applications, the stepwise regression method is a commonly used variable screening method that can find the best regression model by gradually adding or removing independent variables. By selecting the independent variable that is most relevant to the dependent variable, the stepwise regression method can improve the predictive and explanatory power of the model.
Data description:
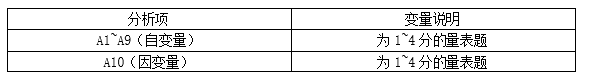
Background note: In this study, we focused on the impact of independent variables A1 to A9 on the dependent variable A10. These variables are data obtained through scale questions ranging from 1 to 5 points, used to evaluate participants' attitudes or perspectives on a specific issue. To analyze the relationship between these variables, we used a stepwise regression method. Stepwise regression is a statistical analysis method that gradually adds independent variables to determine the most predictive variable for the dependent variable, thereby constructing the optimal regression model. Specifically, stepwise regression starts with a constant term and gradually adds independent variables, one at a time, to determine whether to choose the dependent variable based on its significant impact on the dependent variable.
The analysis results are as follows:
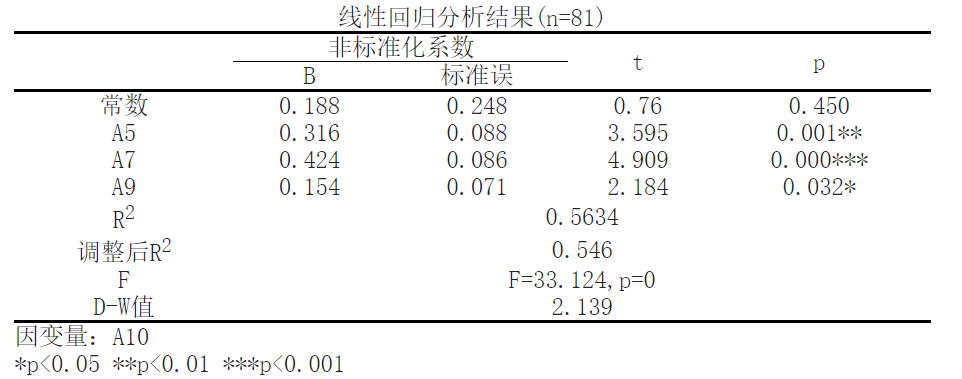
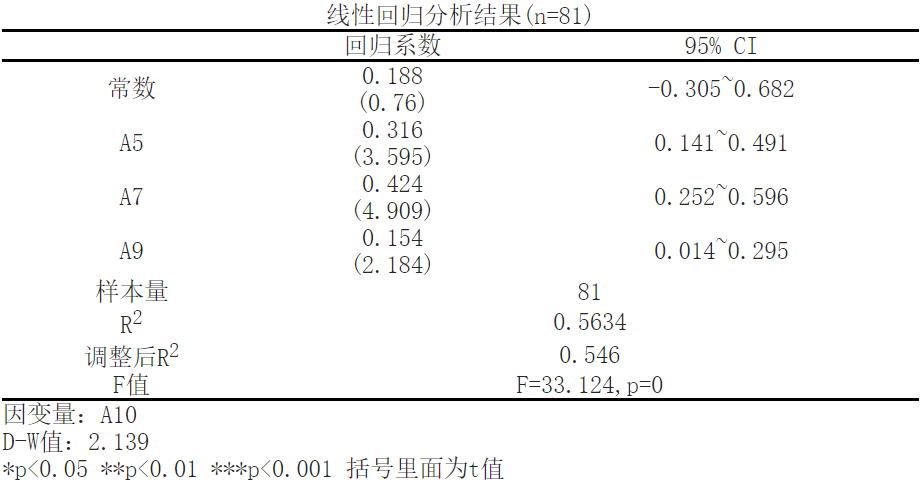
According to linear regression analysis, the results show that with A10 as the dependent variable and ['A5 ',' A7 ',' A9 '] as the independent variable, a multiple regression model is established for the independent and dependent variables. R2 (RSsquare) represents the degree to which the independent variable explains the variation of the dependent variable in the regression model, which is the beginning of analyzing the regression results. The data shows that; The R-squared value of the model is 0.5634, which means that ['A5 ',' A7 ',' A9 '] can explain the 56.34% change in A10. The regression effect of the regression model can be judged through the F-test, which tests whether the linear relationship between the dependent variable and all independent variables is significant, and can also be used to test the statistical significance of the model. According to the results, the F value is 33.124, the P value is 0.0, and the model formula is: A10=0.188+0.316 * A5+0.424 * A7+0.154 * A9.
A5 has a significant positive effect on A10, with a beta value of 0.3159 and a p-value of 0.0006 (p<0.05).
A7 has a significant positive effect on A10, with a beta value of 0.4238 and a p-value of 0.0 (p<0.05).
A9 has a significant positive effect on A10, with a beta value of 0.1541 and a p-value of 0.032 (p<0.05).
Reference:
[1] Cohen, J., Cohen P., West, S.G., & Aiken, L.S. Applied multiple regression/correlation analysis for the behavioral sciences. Hillsdale, NJ: Lawrence Erlbaum Associates. 2003.
[2] Draper, N.R. and Smith, H. Applied Regression Analysis. Wiley Series in Probability and Statistics. 1998.
[3] 孙荣恒.应用数理统计(第三版).北京:科学出版社,2014:204-206
[4] alton, Francis. Regression Towards Mediocrity in Hereditary Stature (PDF). Journal of the Anthropological Institute. 1886, 15: 246–263
关注微信公众号发送【示例数据】获取SPSSMAX练习示例数据。
