Unit Root Test (ADF)
Unit root test (ADF) is a commonly used time series analysis method used to determine whether a time series has a unit root (i.e. non-stationary). Unit root refers to the trend that changes over time and is sustained over time, without converging to a stable mean. ADF test is a testing method based on autoregressive models, which includes a lag term. Its original assumption was that there exists a unit root, which means that the time series is non-stationary.
If the calculation results of the ADF test reject the original hypothesis, that is, at a given level of significance, the time series can be considered stationary. In practical applications, ADF test is a commonly used time series analysis method to determine whether a time series has a unit root. Its calculation process is based on an autoregressive model and eliminates the influence of trends by performing differential operations on the time series. By comparing with the critical value, it can be determined whether the time series is stationary.
Data description:
ADF (Augmented Dickey Fuller) test is a commonly used unit root test method used to test the presence of unit roots (non stationarity) in time series data. In time series analysis in finance, economics, and other fields, the ADF test is widely used to determine whether a variable has stationarity.
The analysis results are as follows:
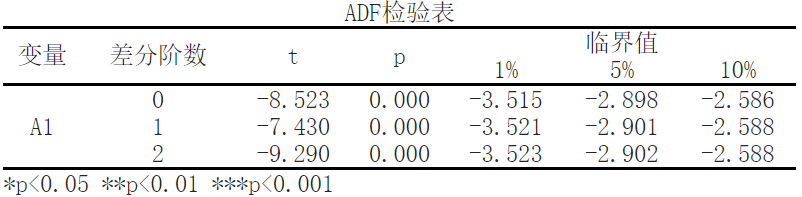
The results of the sequence test show that when the difference is of order 0, the significance P-value is<0.05, showing significance at the horizontal level. Therefore, the original hypothesis is rejected, indicating that the sequence is a stationary time series.
The results of the sequence test show that when the difference is of the first order, the significance P-value is>0.05, and there is no significance at the level. Therefore, the original hypothesis is accepted, indicating that the sequence is not a stationary time series.
The results of the sequence test show that when the difference is of order 2, the significance P-value is>0.05, and there is no significance at the level. Therefore, the original hypothesis is accepted, indicating that the sequence is not a stationary time series.
背景说明:
ADF(Augmented Dickey-Fuller test is a commonly used unit root test method used to test the presence of unit roots (non stationarity) in time series data. In time series analysis in finance, economics, and other fields, the ADF test is widely used to determine whether a variable has stationarity.
Explanation of ADF test results table:
In the test result table you provided, it includes variables, difference order, t-value, p-value, and critical value. Let's explain each indicator one by one.
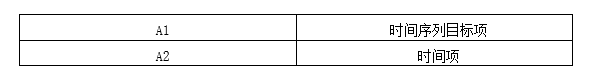
- Variable:In the ADF test results table you provided, the first column is the name of the variable. In this example, the variables are labeled as "A1" and "A2".
- Differential order:The second column indicates how many differentials have been made. Difference refers to the first or multiple order difference operations performed on time series data to eliminate non stationarity. In this example, the "A1" variable is not differenced (with a differencing order of 0).
- T-value:The third column is the statistic of the ADF test, which is the t-value. It is used to measure the stationarity of variables. Generally speaking, if the t-value is less than the critical value, the original assumption can be rejected, that is, there exists a unit root, which represents non-stationary; If the t-value is greater than the critical value, accept the original assumption that there is no unit root, indicating stationarity. In this example, the t-value of the "A1" variable is -8.523, and the t-value of the "A2" variable is not provided.
- P-value:The fourth column is the p-value, which is also used to test the stationarity of variables. The p-value represents the probability of the observed statistic size for a given sample. Usually, if the p-value is less than the significance level (such as 0.05), the original hypothesis can be rejected, indicating the existence of unit roots and non-stationary; If the p-value is greater than the significance level, the original assumption is accepted, indicating that there is no unit root and indicating stationarity. In this example, the p-value of the "A1" variable is 0.000, and the p-value of the "A2" variable is not provided.
- Critical value:The last three columns are the critical values for comparison. These critical values are determined based on the confidence level of the test, with common confidence levels of 1%, 5%, and 10%. If the t-value is less than the critical value, the original hypothesis can be rejected, indicating that the data is non-stationary. In this example, for the "A1" variable, the critical value at a 1% confidence level is -3.515, the critical value at a 5% confidence level is -2.898, and the critical value at a 10% confidence level is -2.586.
In summary, by comparing the t-values, p-values, and critical values in the ADF test results table, it is possible to determine whether the variable has stationarity. If the p-value is less than the significance level and the t-value is greater than the critical value, then we can consider the variable to be stationary. Otherwise, if the p-value is large or the t-value is less than the critical value, then we will accept the assumption of non-stationary behavior。
ADF test chart is a chart used to visualize ADF test results. It is usually a line chart, with the horizontal axis representing the order of difference and the vertical axis representing the values of ADF statistics. In the chart, we can observe the changes of ADF statistics under different difference orders.
ADF test chart is a chart used to visualize ADF test results. It is usually a line chart, with the horizontal axis representing the order of difference and the vertical axis representing the values of ADF statistics. In the chart, we can observe the changes of ADF statistics under different difference orders.
The ADF test chart can also be used to compare the stationarity of different variables. By plotting the ADF test results of multiple variables on the same graph, we can intuitively compare their stationarity. If the ADF statistic value of a variable is closer to zero and tends to stabilize after increasing the order of difference, then we can consider the variable to be more stationary.
In summary, the ADF test chart is a visual tool that helps to determine the stationarity of time series data, helping us choose the appropriate order of difference and compare the stationarity of different variables.
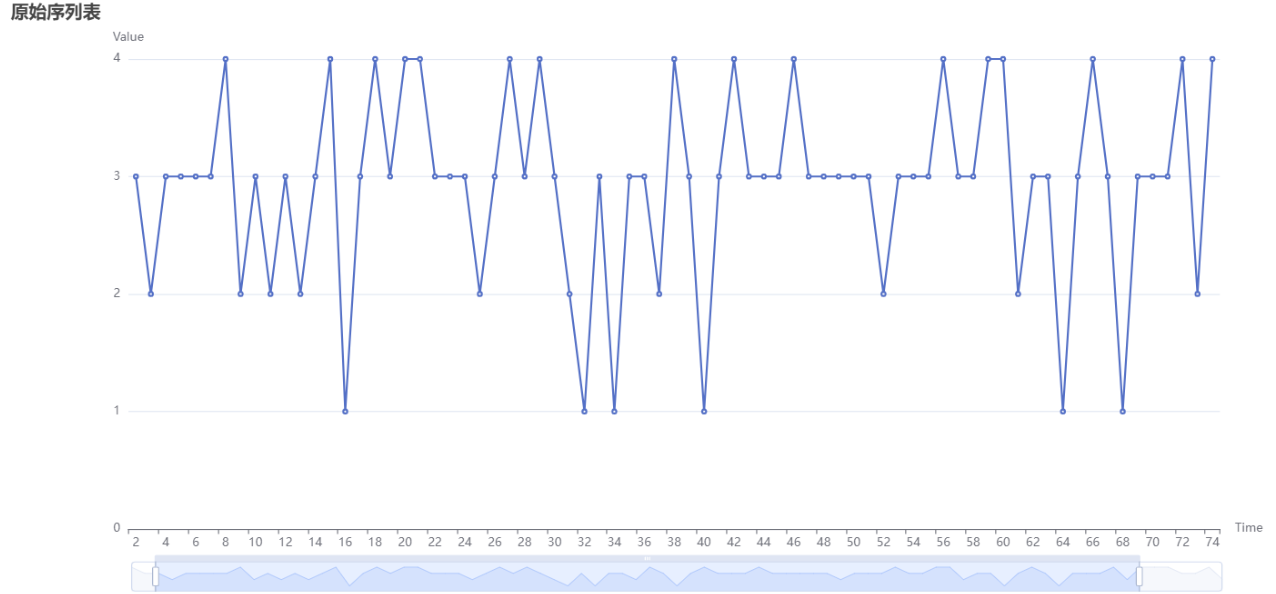
The above figure shows the original image without differentiation. The X-axis represents the time term, and the Y-axis represents the numerical value.
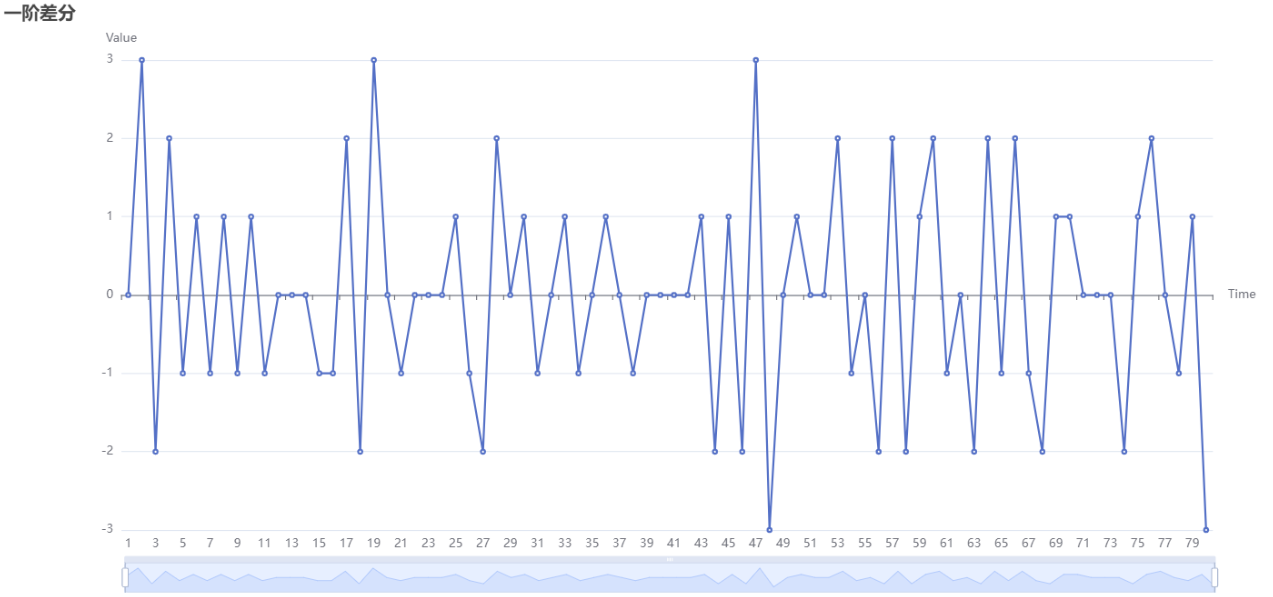
The above figure shows the results of conducting a first-order difference. When the time intervals are equal, subtract the previous value from the next value to obtain a first-order difference.
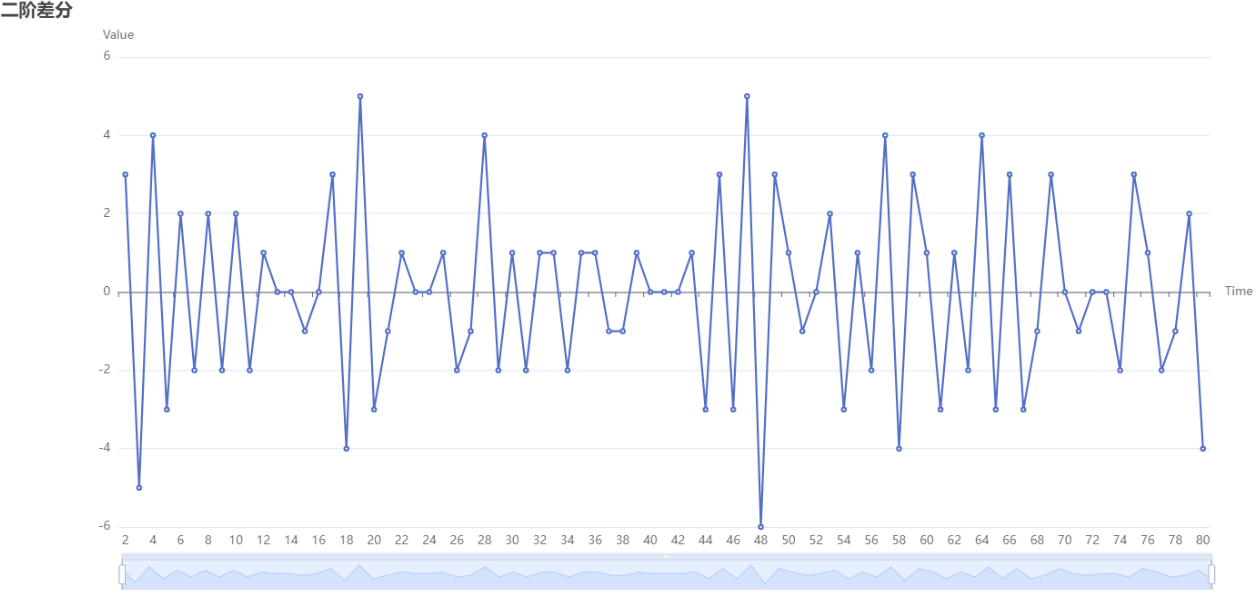
The above figure shows the results of performing second-order difference. Doing the same action twice, that is, subtracting the last value from the first order difference again, is called a "second order difference".
关注微信公众号发送【示例数据】获取SPSSMAX练习示例数据。
