Weighted Chi-Square Test
Weighted chi square test is a statistical method used to compare the differences between two or more categorical variables. It is suitable for situations where the observed values of categorical variables have different weights.
Data description:

Background note: Weighted chi square analysis is a statistical method used to compare the correlation between two or more categorical variables. By calculating the chi square value and p-value, we can determine whether the correlation between categorical variables is significant. In this example, our analysis results indicate that there may not be a significant correlation between the two categorical variables.
The analysis results are as follows:
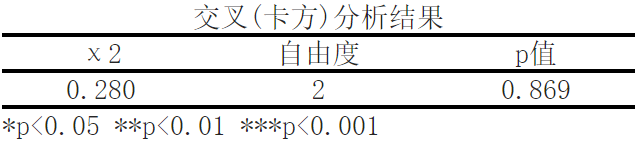
The chi square test results show that using chi square test (cross analysis) to study the difference relationship between data, it can be seen from the above table that the p-value is 0.869>0.05, the chi square value is 0.28, and the degree of freedom is 2, indicating that there is no significant difference between the data, and the data distribution is relatively uniform.
In this weighted chi square analysis result, we can see the following indicators and parameters:
- χ 2 (chi square value): 0.2800.280
- Degree of Freedom: 2
- P-value: 0.869
In this analysis, we compared the correlation between two categorical variables and conducted a weighted chi square test. The following is a detailed explanation of each indicator:
- χ 2 (chi square value): chi square value is a statistic calculated based on the difference between the observed frequency and the expected frequency. It is used to measure the degree of deviation between the observed frequency and the expected frequency. In this example, the chi square value is 0.280.
- Degrees of Freedom: Degrees of freedom refer to the number of independent observations used to calculate chi squared values. In this example, a degree of freedom of 2 indicates that there are two classification variables.
- P-value: p-value is an indicator used to determine whether the chi square value is significant. It represents the observed chi square value or the probability of more extreme situations occurring under the original assumption. In this example, the p-value is 0.869, indicating that the probability of the observed chi square value occurring under the original assumption is 0.869, which is not significant.
It should be noted that * p< in the table; 0.05 indicates that the p-value is less than 0.05, * * p< 0.01 indicates that the p-value is less than 0.01, * * * p< 0.001 indicates that the p-value is less than 0.001. These values are typically used to determine the significance of chi square values. In this example, a p-value greater than 0.05 indicates that we cannot reject the original assumption that there may not be a significant correlation between the two categorical variables.
Reference:
[1]Agresti, A. (2002). Categorical data analysis (2nd ed.). John Wiley & Sons.
[2]Everitt, B. S. (1992). The analysis of contingency tables (2nd ed.). Chapman and Hall.
[3]Agresti, A. (2013). Categorical data analysis (3rd ed.). John Wiley & Sons.
[4]Christensen, R. (2019). Log-linear models and logistic regression (3rd ed.). Springer.
[5]Bishop, Y. M. M., Fienberg, S. E., & Holland, P. W. (1975). Discrete multivariate analysis: Theory and practice. MIT Press.
关注微信公众号发送【示例数据】获取SPSSMAX练习示例数据。
