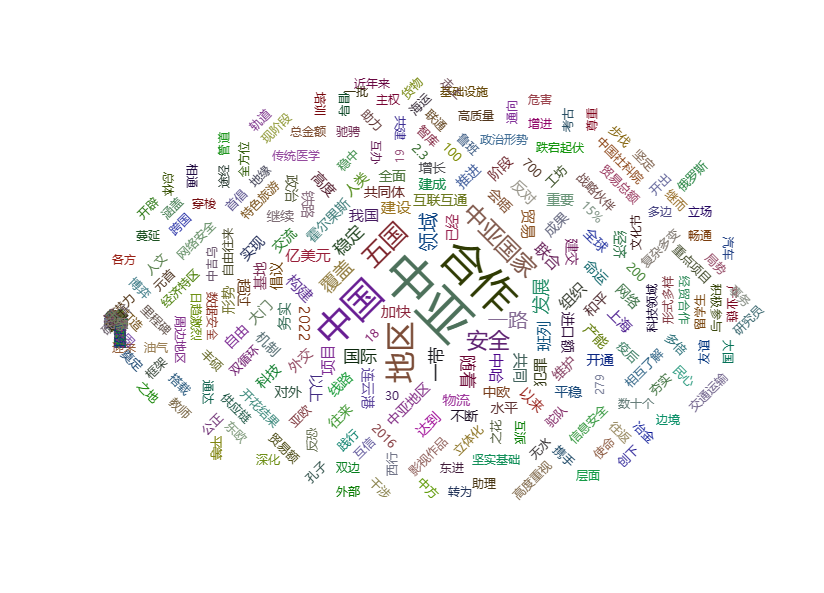
Word Cloud Diagram
A word cloud chart is a chart used to visualize text data. It displays words in different font sizes or colors in charts based on their frequency or importance. Word cloud maps can help us intuitively understand keywords and themes in text data, and help us discover patterns, trends, and important information in the data.
Data description:
Background description:
A word cloud diagram is usually displayed based on the frequency of words appearing, and background explanations can explain the way words are selected. The size of words in a word cloud graph is usually related to their frequency of occurrence in the text. Background explanations can explain the calculation of word weights and the relationship between word size and frequency. This helps readers understand the meaning and relative importance of word size in the word cloud diagram.
The analysis results are as follows:
关注微信公众号发送【示例数据】获取SPSSMAX练习示例数据。
