k-means Clustering
Cluster analysis (K-means clustering) is a center based clustering algorithm that iteratively divides samples into K-classes based on the principle of minimizing the sum of distances between each sample and the center or average of its class. It always pursues the goal of small intra cluster differences and large inter cluster differences, where differences are measured by the distance from the sample point to the centroid of its cluster.
Data description:
Background description:
K-means clustering analysis is a commonly used unsupervised learning method for dividing data samples into different categories. It clusters by minimizing the distance between each sample point and the center of the category. Specifically, it assigns sample points to the nearest category center, updates the category center, and iterates continuously until convergence. K-means clustering analysis is usually used to explore potential patterns and structures in data, and to classify the data.
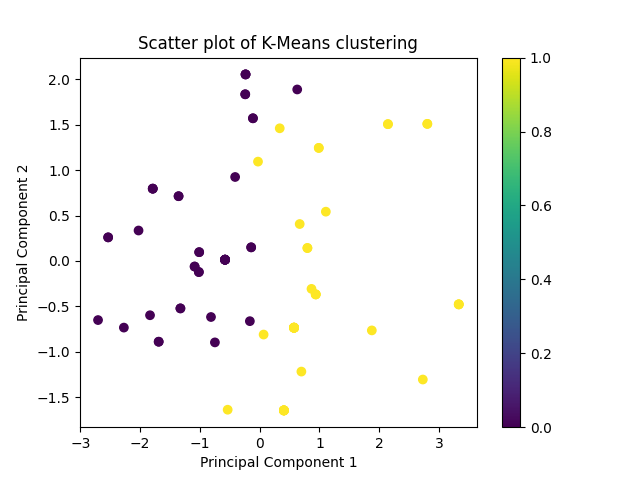
It can be applied in multiple fields, such as market segmentation, image analysis, and biological research. One advantage of it is its simplicity and ease of understanding, but there are also some limitations, such as sensitivity to the selection of initial category centers. In this analysis, K-means clustering analysis was used to divide the data into two different categories based on the characteristics of the variables, and significance tests were conducted to evaluate the differences between the variables in these categories. The above results provide a detailed explanation of the differences between different clustering categories for each variable.
The analysis results are as follows:
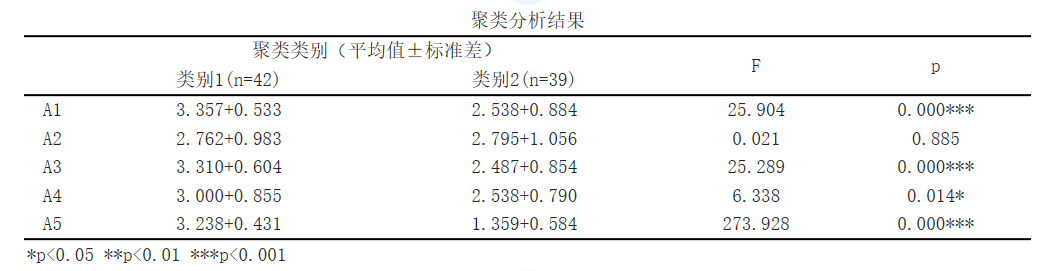
For variable A1, the significance P-value is 0.0<0.05, showing significance at the level, rejecting the original hypothesis, indicating that there is a significant difference between the categories classified by cluster analysis for variable A1.
For variable A2, the significance P-value is 0.885>0.05, showing no significant difference at the level. Accepting the original hypothesis, it indicates that variable A2 has no significant difference between the categories classified by cluster analysis.
For variable A3, the significance P-value is 0.0<0.05, showing significance at the horizontal level. Rejecting the original hypothesis indicates that there is a significant difference between the categories classified by cluster analysis for variable A3.
For variable A4, the significance P-value is 0.014<0.05, showing significance at the level, rejecting the original hypothesis, indicating that there is a significant difference between the categories classified by cluster analysis for variable A4.
For variable A5, the significance P-value is 0.0<0.05, showing significance at the horizontal level. Rejecting the original hypothesis indicates that there is a significant difference between the categories classified by cluster analysis for variable A5.
关注微信公众号发送【示例数据】获取SPSSMAX练习示例数据。
